The given table symbolizes the hourly output and cost structure for a local pizza shop. The market is perfectly competitive and the market price of a pizza in the area is $10. Total costs comprise all explicit and implicit costs.
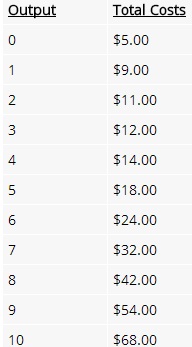
Q1. Compute the total revenue and total economic profit at each level of output.
Q2. Compute the pizza shop’s marginal costs and marginal revenue level of the output. Determine the profit maximizing rate of the output for pizza shop?
Q3. Draw a market supply and demand diagram for the pizza alongside of a corresponding representative firm graph for pizza shop. With respect to the representative firm graph, label the regions that represent the total revenue, total costs and profit. (For ease, draw only the average total cost curve; you require not draw the average variable cost curve.)
Q4. Now in the other set of side by side graphs show the adjustment which occurs in the long run in both the market graph and the corresponding graph for the representative firm. (Describe your answer.)