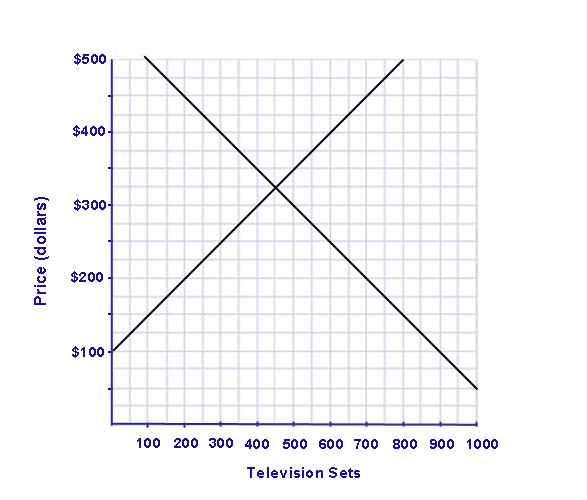
The table and graph shown below illustrate the demand and supply schedules for television sets in Venezuela, a "small" nation that is unable to affect world prices.
| Venezuela Supply and Demand for Television Sets |
| Price Per TV |
Quantity Demanded |
Quantity Supplied |
| $100 |
900 |
0 |
| $200 |
700 |
200 |
| $300 |
500 |
400 |
| $400 |
300 |
600 |
| $500 |
100 |
800 |
In addition to the answer for each item below, describe in a few sentences how you solved each part of the problem. (This will allow the instructor to assign partial credit in case an answer is incorrect.)
- Suppose Venezuela imports TV sets at a price of $150 each. Under free trade, how many sets does Venezuela produce, consume, and import?
- Assume that Venezuela imposes a quota that limits imports to 300 TV sets. Determine the quota induced price increase and the resulting decrease in consumer surplus.
- Calculate the quota's redistributive effect, consumption effect, protective effect, and revenue effect.
- Assuming that Venezuelan import companies organize as buyers and bargain favorably with competitive foreign exporters, what is the overall welfare loss to Venezuela as a result of the quota?
- Suppose that Venezuelan exporters organize as a monopoly seller. What is the overall welfare loss to Venezuela as a result of the quota?