Assignment:
Question 1
Suppose that that inverse demand function for a depletable resource is given by: p=10- q
where p is the price and q is the quantity. Assume that 6 units of the resource are available to be allocated between two periods. Assume that the marginal cost of supplying the resource in each period is $4.
a) Can you modify your diagram so that the statically efficient allocation and dynamically efficient allocation of the resource are the same? If you can, explain the situation by re-drawing a diagram. If you cannot, explain why it is not possible.
Question 2
Suppose that a community is trying to decide how much to spend preserving biodiversity, a public good that provides important ecosystem services. There are two groups (Group 1 and Group 2) in the community and their inverse demand functions are given as:
p1=100-2q1 and p2=80-q2
where pi (i = 1,2) is the price each of the community groups is willing to pay and qi (i = 1,2) is the amount of biodiversity preserved.
a) Draw a diagram illustrating the demand curves for Groups 1 and 2 and the market demand curve for preserving biodiversity. You need to draw three separate diagrams.
Question 3
Suppose that there are two counties (A and B), and the terms of an international agreement require reduction of County A's CO2 emissions by 200 million tons, and those of Country B's emissions by 50 million tons. The table below summarises the emissions reduction policy options for each county, and their cost:
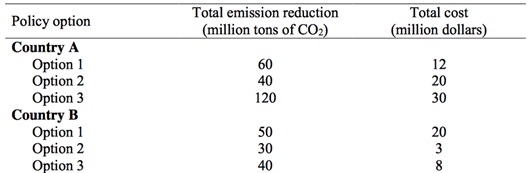
Assume that any of the policy options can be partially implemented at a constant marginal cost. For example, Country A can choose to reduce CO2 emissions with Option 1 by 10 million tons at a cost of $2 million.
a) If the two countries operate independently, how much CO2 emssions will be reduced using each option? Use a diagram to explain your reasoning.
b) Suppose that a market of transferable emission permits is created, so that it allows Countries A and B to trade permits to achieve the overall emission reduction target of 250 million tons. Who has an interest in buying permits? Who has an interest in selling permits? What is the range for the permit price both countries agree to trade their permits? Use a diagram to explain your reasoning.
c) If all permits are initially allocated to Country A, will your result in part b change? Discuss.