Problem 1. Suppose you are stranded on an island by yourself and must therefore produce all the goods you consume. You consume clams and mangoes exclusively. In a week if you devote all your available time to harvesting clams you can harvest 100 clams. If you devote all your available time to collecting mangoes you can find 200 mangoes in a week.
a. Imagine it is possible for you to divide your time between harvesting clams and collecting mangoes and that you can even find fractional amounts of both goods. Draw a sketch of your production possibility frontier for a week. In your drawing place mangoes on the x-axis and clams on the y-axis.
b. Now, sketch your production possibility frontier for a two week period. Describe what happens to your production possibility frontier when you increase the amount of time available for production.
c. Now, imagine you invent a clamrake that enhances your ability to harvest clams. With this invention you are able to increase your clam harvest to a maximum of 200 clams a week if you spend all your time on clams. Your invention has no effect on your ability to collect mangoes. Sketch your new production possibility frontier. Describe in words the effect of a change in technology that affects the ability to produce one of the goods, but not both of the good.
d. Suppose you have your clamrake and, in addition, you procure knowledge over time that enhances your ability to collect mangoes. Your ability to gather mangoes increases to 300 mangoes a week due to this knowledge. Sketch your new production possibility frontier based on this knowledge and your use of the clamrake. In effect you have experienced a change in technology that has a positive effect on the production of both goods: describe in words the effect of this change on the production possibility frontier.
e. What was the original opportunity cost of producing a mango before the technological improvements? What is the opportunity cost of producing a mango after the two changes described in part (d)?
f. Have clams gotten relatively cheaper with the changes described in part (d)?
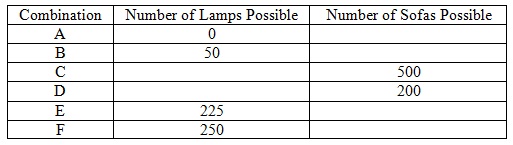
Problem 2. The country of Orange manufactures sofas and lamps. With its available resources and technology Orange can manufacture in a year1000 sofas and 0 lamps or 0 sofas and 250 lamps. It can also manufacture any combination of sofas and lamps that lie on the straight line connecting these two points.
a. Sketch Orange’s production possibility frontier placing sofas on the y-axis and lamps on the x-axis.
b. Fill in the following table giving some of the feasible and efficient combinations of production per year available to Orange given its resources and technology.
c. What is the slope of the production possibility frontier for Orange?
d. What is the opportunity cost of producing one additional sofa for Orange?
e. What is the opportunity cost of producing one additional lamp for Orange?
f. What is the value of the y-intercept for Orange? (Hint: in this example, the y-intercept is the number of sofas Orange can produce if it does not produce anything else.)
g. Write an equation for the production possibility frontier for Orange using S to stand for sofas and L to stand for lamps. Write this equation in y-intercept form (hint: this means that the equation will be written with S on the left-hand side of the equation where the S stands for the value of the variable measured on the vertical axis of your sketch). Verify that each of the combinations you found in part (b) of this problem are true for the equation you wrote.
Problem 3. The country of Utopia produces two goods from their available resources and technology. The only resource that Utopia has is labor. It takes three hours of labor to produce two widgets and four hours of labor to produce one gadget. For this question assume that the production possibility frontier for Utopia is a straight line.
a. Sketch the production possibility frontier for the country of Utopia. (Hint: to do this you must first decide on a relevant time period. You might pick 20 hours, or 2000 hours, or 2 million hours as your labor constraint for example and then you would sketch your production possibility frontier based on this amount of available time and labor.) Draw your production possibility frontier with widgets on the y-axis and gadgets on the x-axis.
b. What is the slope of your production possibility frontier?
c. What is the opportunity cost of producing an additional widget in Utopia?
d. What is the opportunity cost of producing an additional gadget in Utopia?
Problem 4. What will happen to the equilibrium price and quantity in these markets if the following changes occur? Assume everything else is held constant in the following examples. Hint: you will find it helpful to sketch a graph of the market before the event and after the event noting what happens to price and quantity.
a. The cost of wheat, which is used to produce bread, decreases. What will happen to the equilibrium price and quantity in the bread market?
b. New technology for manufacturing automobiles lowers the cost of producing an automobile. What will happen to the equilibrium price and quantity in the automobile market?
c. The fall this year has been unusually cool (but not cold). What will happen to the equilibrium price and quantity in the market for sweatshirts?
d. In the market for new cars, there has been a change in demand due to a fall in consumers’ income while at the same time the cost of labor used to produce cars has fallen. Assume new cars are a normal good.
e. In the market for pasta dinners people’s tastes and preferences have changed from favoring a high carbohydrate diet to a high protein diet (pasta is high in carbohydrates) while at the same time people’s incomes have fallen. Assume pasta dinners are an inferior good.
Problem 5. Consider the market for chocolate. The demand curve and supply curves are given by
Demand: P = 10 - (1/3)Q
Supply: P = Q + 2
a. Find the equilibrium price and quantity in the market for chocolate.
b. Assume the supply curve for chocolate shifts to the left by 2 units at every price. Write the equation for the new supply curve for chocolate and then find the new equilibrium price and quantity in the market for chocolate. How much did the price change relative to its initial level?
Now consider the oil market. Suppose that the supply function is the same as above, but the demand function is different:
Demand: P = 44 – 6Q
Supply: P = Q + 2
c. What do the differences in slope for the demand functions for chocolate and oil imply? (Hint: for chocolate, if the price increases by one, then the quantity demanded decreases by 3 units. For oil, if the price increases by one, then the quantity demanded decreases by only 1/6 of a unit.)
d. Find the equilibrium price and quantity in the oil market.
e. Now assume there is also a supply shock in the oil market and the supply curve for oil shifts to the left by 2 units for any price. Write an equation for the new supply curve for oil and then find the new equilibrium price and quantity in the oil market. By how much did the price change?
f. Compare the changes in price in parts (b) and (d). Where is the change in price larger? Explain your answer.
Problem 6. Consider the market for wheat. Currently Fantasia, a small economy, does not engage in trade with other countries. The domestic demand curve for wheat in Fantasia is given by the equation P = 1000 – Q. The domestic supply curve for wheat in Fantasia is given by the equation P = 4Q.
a. What is the equilibrium price and quantity in this market if Fantasia is a closed economy?
b. What is the value of consumer surplus in this market if Fantasia is a closed economy?
c. What is the value of producer surplus in this market if Fantasia is a closed economy?
d. What is the value of total surplus in this market if Fantasia is a closed economy?
e. Draw a graph of the wheat market representing the equilibrium price, equilibrium quantity, and the areas of consumer surplus, producer surplus, and total surplus for Fantasia if Fantasia is a closed economy. Make sure everything is labeled clearly in your graph.
Problem 7. Using the information in question (6), suppose Fantasia opens its wheat market to trade. Furthermore, suppose the world price for wheat is $500 per unit of wheat.
a. Given this world price, will Fantasia import or export wheat? Identify the number of units of wheat Fantasia will import or export.
b. Draw a new graph illustrating the areas of producer surplus, consumer surplus, and total surplus once Fantasia opens its market for wheat to trade. Label your graph completely.
c. What is the change in consumer surplus when Fantasia opens its wheat market to trade?
d. What is the change in producer surplus when Fantasia opens its wheat market to trade?
e. Do both domestic consumers and domestic producers favor opening Fantasia’s wheat market to trade? Explain your answer.
f. Is trade beneficial to Fantasia in this example?
Problem 8. Using the information in question (6), suppose Fantasia opens its wheat market to trade. Furthermore, suppose the world price for wheat is $500 per unit of wheat. Fantasia also passes legislation limiting the amount of wheat imports to 100 units. Hint: you will find it helpful to draw a graph sketching out the effect of this legislation on the market for wheat.
a. How many units of wheat will Fantasia import or export given this information and the legislation?
b. What is the value of consumer surplus given this legislation?
c. What is the value of producer surplus given this legislation?
d. What is the value of license holder revenue given this legislation?
e. What is the value of the deadweight loss associated with this legislation?
f. In this question compare the outcome Fantasia experiences when it opens its wheat market to trade versus opening its wheat market but limiting imports to 100 units of wheat. Do domestic producers or domestic consumers benefit from this legislation? Explain your answer.
Problem 9. Smalltown is concerned about pollution and the ill effects of car travel on their community. Currently the demand for gas in Smalltown is given by the equation P = 5 – (1/200)Q where Q is gallons of gas. The supply of gas is given by the equation P = (1/800)Q.
a. What is the current equilibrium number of gallons of gas in Smalltown?
Community leaders in Smalltown determine that too many miles are being driven in Smalltown due to the pollution and congestion effects of this driving. They decide that the optimal amount of driving corresponds to a gas consumption level of 400 gallons. Suppose that the city council in Smalltown passes an ordinance placing an excise tax on gas so that only 400 gallons of gas will be used in Smalltown. Hint: you will find it helpful to draw a graph of this market for gas to answer this question.
b. What is the tax per gallon of gas?
c. What is the change in consumer surplus due to the imposition of this excise tax on gas?
d. What is the change in producer surplus due to the imposition of this excise tax on gas?
e. How much tax revenue does Smalltown receive when they impose this excise tax?
f. What is the deadweight loss associated with the imposition of this excise tax?