Assignment:
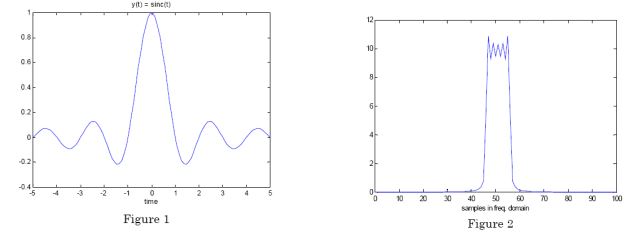
A continuous time function is seen below in figure 1. This signal is a sinc function defined as y(t) = sinc(t). The Fourier transform of this signal is a rectangle function.
1. Use the function linspace to create a vector of time values from -5<=t<=5. Next, plot the functon shown in figure 1 using the sinc function for y(t)=sinc(t).
2. Using MATLAB and the command fft, show that the Fourier transform pair is indeed a rectangle function. Use the command fftshift to center your plot. Don't forget that the Fourier transform is complex with both magnitude and phase. Your results should be the same as figure 2. Show both your mfile code and plot.
3. Using the same time values, plot the continuous time function defined as y(t)=sinc(2t).
4. Plot the transform pair for this signal.
Question 1. What is the "ringing" caused from seen on top of the rectangular pulse shown in figure 2?
Question 2. In step 3 above, the sinc function gets compressed or smaller by the factor of 2. What happened to the rectangular pulse in the frequency domain? What property does this represent?