Problem 1. Shift/Movements along Supply and Demand
Assume there are a downward sloping demand curve and an upward sloping supply curve for DVD players. Each of the statements will change this equilibrium point by shifting either the demand or supply curve. Explain what will happen to the equilibrium price and quantity in the market for DVDs if the following changes occur. Assume that there are no other changes in this market other than the stated change.
a. Four manufacturers of DVD players close factories in the U.S.
b. Manufacturers have a new technology and thus the production cost for DVDs is reduced by 40%.
c. Recording artists demand a doubling of all royalties.
d. Napster, an internet file sharing company that allows people to share music/movie files, is allowed to operate. Access to Napster allows people to play music without possessing the DVD of that music.
e. The price of each DVD disc decreases.
Problem 2. Market Demand Curve
Consider the market for chocolate. The market supply curve is given by Q=2P. Let Mary’s demand curve for chocolate be Q=3-P and Bob’s demand curve is Q = 6-P. Suppose Mary and Bob are the only consumers of chocolate in this market.
a. Graph Mary’s demand curve and Bob’s demand curve on separate graphs. Graph the market supply curve on each of the separate graphs.
b. Now on a new graph, graph the market demand curve for chocolate by horizontally summing Mary and Bob’s demand curves.
c. According to question (b), what is the market demand function for chocolate? (Hint: your market demand curve will be composed to two linear segments and therefore you will have two demand curves in your answer. You will need to specify the relevant quantity or price ranges for these two demand curves.) What is the equilibrium price and quantity in the market for chocolate?
d. Now assume the market supply curve for chocolate shifts to the right by 2 units at every price. Write the equation for the new supply curve for chocolate and then find the new equilibrium price and quantity in the market for chocolate.
Problem 3. Comparative Advantage
Analyze the following two countries. In one day in country A, it takes 24 workers to produce an airplane and 6 workers to produce a boat. In one day in country B, it takes 8 workers to produce an airplane and 4 workers to produce a boat. Both countries have 48 workers available each day.
a. Draw the PPF of each country for one day’s worth of production. Use a separate graph for each country. In your graphs measure airplanes on the horizontal axis and boats on the vertical axis. Carefully label each graph with the respective country’s name. Label the horizontal and vertical axis as well.
b. Answer the following questions.
What is the opportunity cost of producing an airplane in country A?
What is the opportunity cost of producing an airplane in country B?
What is the opportunity cost of producing a boat in country A?
What is the opportunity cost of producing a boat in country B?
c. Answer the following questions.
Which country has an absolute advantage in airplane production?
Which country has an absolute advantage in boat production?
Which country has a comparative advantage in producing airplanes?
Which country has a comparative advantage in producing boats?
d. Suppose the countries trade with each other. Which country will export airplanes? And which country will export boats? What is the range of possible airplane prices (in terms of boat)?
e. Draw the combined PPF of these two countries in a graph with airplanes on the horizontal axis and boats on the vertical axis. (Hint: this is one you will have to think about a bit….start by imagining that both countries devote all of their resources to producing a single good. Then, ask the question what happens if we increase the production of the other good by one unit? And, if we increase the production of the other good by one unit, which country will produce this additional unit?)
Problem 4. Price Intervention
Consider the potato market in Madison. The demand curve and supply curve are given by
Demand: Q = 6 – P,
Supply: Q = P + 2 ,
where the price of potatoes is given per pound and the quantity of potatoes is measured in pounds.
a. Draw a graph of the supply and demand curves in this market. Find the equilibrium price and quantity on this market.
b. Suppose the government sets the price ceiling at P = $4/lb. Find the new equilibrium price and quantity on this market and determine whether or not there is excess demand or excess supply.
c. Now, in an attempt to raise farmer revenue, the government implements a price support program with price floor at P = $3/lb. How many units of potatoes will be demanded by consumers with this price floor? How many units of potatoes will be supplied with this price floor? At the price floor determine whether or not there is excess demand or excess supply in the market for potatoes.
d. Find the direct cost to the government for this support program described in part (c). In your graph shade the area that represents the direct cost. Suppose further that there is a storage cost of $2 per pound of potatoes purchased by the government. Find the total cost of the support program, including the storage cost.
e. Suppose the government decides to support this price floor using a subsidy program. There is no longer a cost for storage, and the guaranteed price equals the floor price, P = $3/lb. How many units of potatoes will be demanded by consumers with this subsidy program? How many units of potatoes will be supplied with this price subsidy program? What is the cost to the government for this subsidy program? In your graph shade the area that represents the cost to the government for this subsidy program and label this area clearly. What is the cost to consumers of this subsidy program? In your graph shade the area that represents the cost to consumers of this subsidy program and label this area clearly.
Problem 5. Consumer Surplus and Producer Surplus
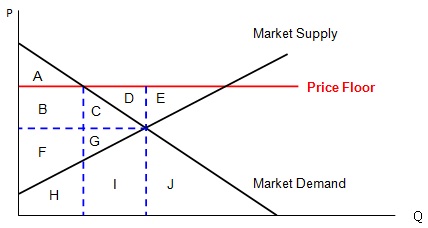
Use the graph above to answer the following questions:
a. Which area(s) is (are) the consumer surplus before the price floor?
b. Which area(s) is (are) the producer surplus before the price floor?
c. Which area(s) is (are) the consumer surplus after the price floor?
d. Which area(s) is (are) the producer surplus after the price floor?
e. Which area(s) is (are) the deadweight loss after the price floor?
f. Which area(s) represent(s) the area of producer surplus transferred from the consumer surplus to the producer surplus after the imposition of the price floor?