Assignment:
Part I :
Q1. Daily Revenue The daily revenue from the sale of a product is given by R = -0.1x³ + 11x² - 100x dollars, where x is the number of units sold.
a. Graph this function on the window [-100,100] by [-5000, 25,000]. How many turning points do you see?
b. Because x represents the number of units sold, what restriction should be placed on x in the context of the problem? What restriction should be placed on y?
c. Using your result from part (b), graph the function on a new window that makes sense for the problem.
d. What does this function gives as the revenue if 50 units are produced?
Q2. Investment If $2000 is invested for 3 years at rate r compounded annually, the future value of this investment is given by S=2000(1+r)³, where r is the rate written as a decimal.
a. Complete the following table to see how increasing the interest rate affects the future value of this investment.
|
r(rate)
|
S(future value,$)
|
|
0%
|
|
|
5%
|
|
|
10%
|
|
|
15%
|
|
|
20%
|
|
b. Graph this function for 0< r < 0.24.
c. Use the table and/ or graph to compare the future value if r=10% and if r=20%. How much more money is earned at 20%?
d. Which interest rate, 10% or 20%, is more realistic for an investment?
Q3. Profit The weekly revenue for a product is given by R(x)=120x-0.015x², and the weekly cost is C(x)=10,000+60x-0.03x²+0.00001x³,where x is the number of units produced and sold.
a. How many units will give maximum profit?
b. What is the maximum possible profit?
Part II :
Q1. Homicide Rates The table below gives the U.S. homicide rates per 100,000 people for the years from 1990 through 2001.
a. Makes a scatter plot of the data, with x equal to the number of years after 1990. Does it appear that a cubic or quartic function would be the better fit for the data?
b. Find the cubic function that is the best for the data, with x equal to number of years from 1990.
c. The data for 2001 includes the 9/11 terrorism deaths. Would you expect the 2002 rate to be higher or lower than the 2001 rate?
|
Year
|
Homicide Rate
|
Year
|
Homicide Rate
|
|
1990
|
10.0
|
1996
|
7.9
|
|
1991
|
10.5
|
1997
|
7.4
|
|
1992
|
10.0
|
1998
|
6.8
|
|
1993
|
10.1
|
1999
|
6.2
|
|
1994
|
9.6
|
2000
|
6.1
|
|
1995
|
8.7
|
2001
|
7.1
|
Q2. Single-parent Families The following table gives the single-parent families as a percent of all families for the years 1960 through 1998.
a. Graph the data points from the table, with x equal to the number of years after 1950 and y equal to the percent of all families.
b. Find the cubic model that is the best fit for the data, with x equal to the number of year's after1950.
c. Find the power function that is best fit for the data, whit x equal to the number of years after 1950.
d. Does the cubic model appear to be better fit for the data, or do the models appear to fit equally well?
|
Year
|
Single Parent Families (%)
|
Year
|
Single Parent Families (%)
|
|
1960
|
9.1
|
1992
|
29.7
|
|
1965
|
11.0
|
1993
|
30.2
|
|
1970
|
12.9
|
1994
|
30.8
|
|
1980
|
21.5
|
1995
|
31.0
|
|
1985
|
26.3
|
1996
|
31.6
|
|
1990
|
28.1
|
1997
|
32.0
|
|
1991
|
28.9
|
1998
|
31.7
|
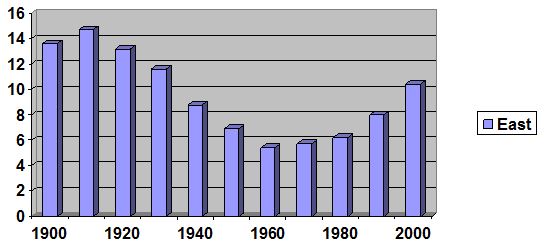
Q3. Foreign-Born Population The percent of the U.S. population that was foreign born during the years 1900-2000 is given in the graph below.
a. Find the cubic function that is the best fit for the data, using x= 0 in 1900.
b. What was the percent of the U.S. population that was foreign born in 1975, according to the model?
Part III :
Q1. Arrests The annual number of arrests by the New York State Police for driving infraction is given by y=1.6 46x³-18.494x²+39.403x+838.950, where y is thousand and x is the number of years from 1990.
a. What does the model estimate the number of arrests to be in 1995?
b. Use technology to find the year after 1995 when there will be 813,310 arrests, according to this model.
Q2. Japanese Economy The percent change y in the Japanese gross domestic product (GDP) for years since 1997 is given by y = 0.148x4-5.829x³ + 85.165x²-545.851x+1293.932, where x is the number of years after1990.
a. Use graphical or numerical methods with this model to find the year before 1999 when the change in GDP was approximately 1.3%
b. According to this model, will the change in GDP ever be 1.3% again?
Part II :
Q1. Births The number of births to females in United State under 15 years of age can be modeled by the function y=0.000876x³-0.0492x²+0.831x+6.922, where y is the number of thousand of births and x is the number of years from 1960. If the model indicates that 11,224 births occurred in 1990, find two other years when the model indicates that 11,224 births occurred.
Provide complete and step by step solution for the question and show calculations and use formulas.