Production and Cost:
Problem 1. You are given the following table where Q is the quantity of output, L is the number of labor units, K is the number of units of capital, MPL is the marginal product of labor (the change in output divided by the change in labor), VC is variable cost, FC is fixed cost, TC is total cost, AVC is average variable cost (variable cost divided by output), AFC is average fixed cost (fixed cost divided by output), ATC is average total cost (total cost divided by output or AVC + AFC), and MC is marginal cost (the change in total cost divided by the change in output). For the problem assume that capital is fixed and does not change as the level of output changes. Furthermore, assume that labor and capital are the only inputs used to produce the output.
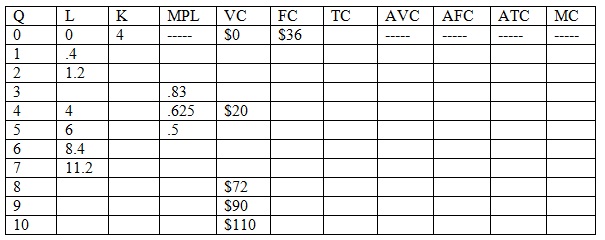
a. Fill out the above table. In filling out this table you may find it helpful to remember the following:
TC = (price of labor)(number of units of labor) + (price of capital)(number of units of capital)
VC = (price of labor)(number of units of labor)
FC = (price of capital)(number of units of capital)
In addition, assume that from the production function and the input costs we can also write variable costs as VC = Q2 + Q and total cost as TC = FC + Q2 + Q
b. What is the price of a unit of capital?
c. What is the price of a unit of labor?
d. Write two equations for TC given the above information and the work you have done in filling out the table.
e. Suppose for the firm depicted in the above table that we can write its MC as MC = 2Q + 1. What is the optimal output level for this firm given the information you have about its cost function and this marginal cost equation?
f. Suppose this firm is currently breaking even, that is, its economic profit is equal to $0. What must the market price be given this information?
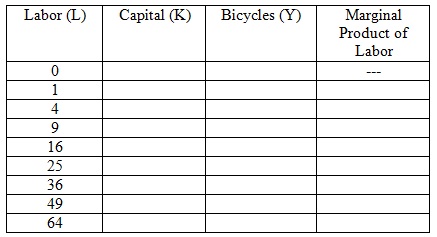
Problem 2. Suppose you are told that a firm’s production function for producing bicycles is given by the equation Y = 10L.5K.5 (hint: remember that L.5 is the same as the square root of L) where Y is the number of bicycles produced, L is the amount of labor used, and K is the amount of capital used. Furthermore, suppose that capital is constant and equal to 100 units.
a. Fill in the following table. (Hint: you may find it saves you time to use Excel to do your calculations here.)
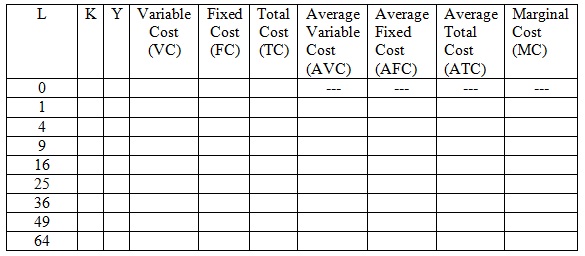
b. Now, suppose that you know that the price of each unit of capital is $1 and the price of a unit of labor is $500. Complete the following table given this information and the work you did in part (a).
c. Does this production function for bicycles exhibit diminishing marginal returns to labor? Explain your answer.
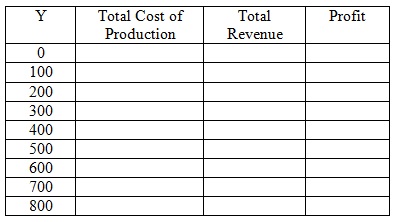
d. Suppose that the price of a bicycle is $55. Given this price and the number of bicycles the firm produces you can calculate the firm’s total revenue (price times quantity equals total revenue). Use this information and your previous work to complete the following table. Although we may not have talked about profit, I think you can figure out that profit will equal the difference between total revenue and total cost. If this firm wishes to profit maximize, how many bicycles should they produce? (Hint: in your table you are going to find two quantities that result in the highest level of profits, but you might want to think about what is the quantity that leads to the maximum profit. This is definitely a challenge question for you!)
Perfect Competition:
Problem 3. Suppose that you are told that the market demand curve for a perfectly competitive industry is given by the equation P = 100 – Q while the market supply curve is given by the equation P = (1/9)Q. Furthermore, you are told that all firms in this industry are identical and that the MC curve for one of these firms is given by the equation MC = (1/2)q where q is the quantity produced by a representative firm.
a. What are the market equilibrium price and quantity in this market?
b. At the equilibrium found in part (a), what quantity does a representative firm produce?
c. Suppose you are told that there is an increase in input prices so that at every price the market supply changes by 90 units. What is the new market supply curve given this information? What is the new equilibrium price and quantity in this market? What quantity will a representative firm produce given this change in input prices?
Utility, Optimality and Income/Substitution Effects
Problem 4. Consider a consumer with the following information.
• Utility = Y3X
• MRS of good X for good Y = Y/(3X)
• PX = 1
• PY = 3
• Income (I) = 16
a) Find the optimal consumption bundle with these prices. (Hint: set MRS = price ratio from the budget line).
b) What is the consumer’s utility with the consumption bundle you found in part a)?
c) Now, let PX = 4. What is the new optimal consumption bundle?
d) Look at the new consumption bundle you found in part c) and compare it to the one you found in part a). Are goods X and Y substitutes, complements or neither? Why? (Hint: look at how consumption of good Y responds to the price change in good X.)
e) What is the new utility with the consumption bundle you found in part c)?
Now, let’s examine substitution and income effects on good X. Notice that the consumption of good X decreases after the price increase. This is based on both the income effect (purchasing power has fallen) and the substitution effect (good X has become relatively more expensive). We can determine how much of this decrease is due to the income and substitution effects numerically.
f) Find a hypothetical combination of X and Y that can give you the level of utility you found in part b), but with the new prices from part c). (Substantial hint: Set the MRS equal to the new price ratio. Use the utility function, but set U = the original level of utility. Find the hypothetical combination of goods X and Y that satisfy this level of utility.) What is the consumption of good X in this hypothetical combination?
g) Determine the substitution effect by taking the quantity of X that you found in part a) and subtracting the hypothetical quantity of good X you found in part f). Since these two combinations are both on the same indifference curve (they yield the same level of utility) they show how the consumer would substitute away from the more expensive good under the new prices.
h) Determine the income effect by taking the hypothetical quantity of X that you found in part f) and subtracting the quantity of X that you found in part c). Both of these quantities take the new prices as given, so the difference in the consumption of X is purely based on the consumer having a lower income (less purchasing power) when the price of X increases.
Perfect Complements:
Problem 5. Johanna enjoys skiing and purchases skis and bindings. Since each ski needs a binding (and bindings are useless without skis) skis and bindings are perfect, one-for-one complements. Johanna spends her entire equipment budget of $1200 on these two goods. The price of skis is $200 each and the price of bindings is also $200 each.
a) Draw an indifference curve for Skis and Bindings with Skis on the vertical axis and Bindings on the horizontal axis. Also draw the budget set and label the optimal consumption point (since the two are perfect complements, this should require very little math).
b) Now suppose that the price of bindings goes up to $400 each. What are the income and substitution effects of this price increase? Explain your answer in detail and show your work graphically.
c) Why does the substitution effect you found in part b) make sense? What is it about this particular question that leads to the results you find?
Perfect Substitutes:
Problem 6. A consumer’s utility function depends form the quantity of two goods X and Y and it is equal to U=18X+3Y. The prices of two goods are PX = 50 and PY = 20 and his income I= 500.
a) Draw the budget line for this consumer. Put good X on the X axis and good Y on the Y axis.
b) Draw an indifference curve for this consumer. (Hint, pick some level of utility and graph combinations of X and Y that achieve that level of utility. Choosing the level of utility “wisely” will help you get whole numbers for X and Y).
c) Given the indifference curve you drew in part b), are goods X and Y perfect complements, perfect substitutes or neither?
d) What is the optimal consumption bundle of good X and Y? (Hint, parts a-c should help you a lot here).