I. Binary Choice (10 questions)
Use the information below to answer the next THREE (3) questions.
On February 13, 2016 the Wall Street Journal reported that the "percentage of white men in their 30s and 40s with a working-class job or no occupation [i.e., not classified as a professional] and [with] no more than a high-school diploma or GED" participating in the labor force fell from approximately 96% in 1970 to 79% in 2015. Looking at this same population, the percentage that was married in 1970 was approximately 86% while in 2015 the percentage that was married was at 52%. [This data is from the Current Population Survey.]
Problem 1. Given the above figures, which of the following statements is a normative statement?
a. These figures reflect some kind of sampling bias and these numbers should not be trusted.
b. These figures, if true (and there is no reason to question their validity) represent a significant change in the U.S. economy and the economic prospects of this group of individuals.
Problem 2. Given the above data, what was the percentage change in the rate of marriage between 1970 and 2015?
a. A decrease of approximately 34%.
b. A decrease of approximately 40%.
Problem 3. Given the above information, it is likely that:
a. The U.S. economy was producing at a point located inside its production possibility frontier in 2015.
b. The U.S. economy was producing at a point located beyond its production possibility frontier in 2015.
Problem 4. Suppose that you are told that Mindy has a linear production possibility frontier and that two points on this production possibility are (2 pens, 4 erasers) and (4 pens, 3 erasers). Given this information, what is the maximum amount of pens that Mindy can produce?
a. 5 pens
b. 10 pens
Problem 5. Suppose an economy is currently producing on its PPF. The two types of goods available for this economy are capital goods and consumer goods. If economic growth in the next period is the primary goal for this economy then:
a. This economy should produce as many capital goods as possible this period of time.
b. This economy should produce as many consumer goods as possible this period of time.
Problem 6. Consider the market for pineapples in the small closed economy of Sweetland. Currently domestic pineapples sell for $2 in Sweetland while the world price is $1.20. If Sweet land opens their market to trade while simultaneously imposing an effective import quota on pineapples we can expect that:
a. Domestic consumers of pineapples will pay less than $2 per pineapple and more than $1.20 per pineapple.
b. The import quota will decrease producer surplus relative to the level of producer surplus that would occur if this market were simply opened to trade.
Problem 7. Consider a market for a good described by demand and supply curves. If this market is not currently at its equilibrium and if prices are free to adjust, then we can expect:
a. Prices to fall if the demand for the good is greater than the supply of the good.
b. Prices to rise if the demand for the good is greater than the supply of the good.
Problem 8. You are told that the demand and supply curves for a good can be represented by the following equations where P is the price per good and Q is the quantity of the good:
Demand: Q = 75 – 3P
Supply: Q = 3P - 15
Suppose the government legislates that this good must sell for $12 and that this imposed policy is an effective policy.
Given this information and holding everything else constant, you conclude that the government has implemented a price:
a. floor.
b. ceiling.
Problem 9. Consider the market for mangoes. Currently Smalltopia is a small closed economy where mangoes sell for $1.20 a mango. The world price of mangoes is currently $0.90. If Smalltopia opens this market to trade and everything else is held constant, then:
a. Domestic consumer surplus in Smalltopia's mango market will decrease.
b. Domestic producer surplus in Smalltopia's mango market will decrease.
Problem 10. Consider the two markets for goods A and B represented in the following graphs.
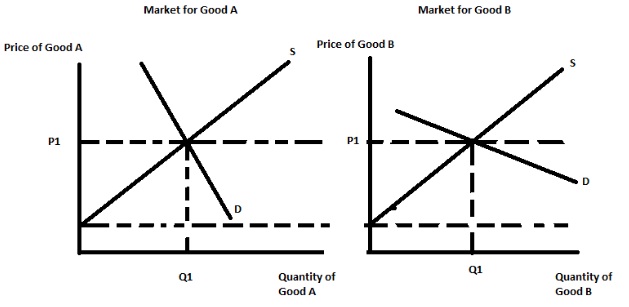
In each market the initial equilibrium price and quantity happen to be exactly the same (Q1, P1). Suppose that the government is discussing the implementation of an excise tax of $x amount in both markets (the amount of the excise tax will be the same in both markets). Given this information and the above graphs, the tax revenue from this excise tax will be greater in the market for:
a. Good A.
b. Good B.
II. Multiple Choice
Problem 11. Initially the price of umbrellas in Twinsport is $13 and 100 umbrellas are supplied and demanded at that price. This year however the price of umbrellas has risen to $16 per umbrella and the equilibrium quantity of umbrellas demanded and supplied in the market has risen to 120 umbrellas. Given this information, which of the following explanations is the best explanation?
a. The supply curve has shifted to the right and the demand curve has also shifted to the right, but the supply curve shift is greater than the demand curve shift.
b. The supply curve has shifted to the left and the demand curve has shifted to the right, but the supply curve shift more than offsets the demand curve shift.
c. The demand curve has shifted to the right and there is a movement along the supply curve.
d. The supply curve has shifted to the right and there is a movement along the demand curve.
Problem 12. Consider the market for pencils that is initially in equilibrium. Suppose that people's incomes increase while at the same time the costs of producing pencils increases. Assume that pencils are a normal good. Given this information and holding everything else constant you conclude that:
a. The new equilibrium price is indeterminate relative to the initial equilibrium price in the market for umbrellas.
b. The new equilibrium quantity is indeterminate relative to the initial equilibrium quantity in the market for umbrellas.
c. The new equilibrium price has increased and the new equilibrium quantity has increased relative to their initial levels.
d. The new equilibrium price has decreased and the new equilibrium quantity has increased relative to their initial levels.
Problem 13. Fracking technology has substantially lowered the cost of producing oil. At the same time, public concern over climate change has altered many people's decisions about driving gas-powered cars. Given these two events, what do you predict will happen to the equilibrium price of gasoline and the equilibrium quantity of gasoline?
a. The equilibrium price of gasoline will decrease while the equilibrium quantity of gasoline will increase.
b. The equilibrium price of gasoline will increase while the equilibrium quantity of gasoline will decrease.
c. The equilibrium price of gasoline will decrease while the effect on the equilibrium quantity of gasoline is indeterminate.
d. The effect on the equilibruim price of gasoline is indeterminate while the equilibrium quantity of gasoline will decrease.
Answer the next two (2 questions) using the following information.
Consider the market for gasoline that can be described by the following demand and supply equations where P is the price per gallon and Q is the quantity of gasoline in gallons:
Demand: P = 20 - 2Q
Supply: P = 2 + Q
Problem 14. Suppose the government decides to implement an excise tax in the market for gasoline. It levies an excise tax of $3 per gallon of gasoline on producers of gasoline. Which of the following statements is true given the above information and the implementation of this excise tax?
I. Consumer tax incidence and producer tax incidence is equal to one another and together sum to total tax revenue.
II. There is no change in the amount of gasoline consumed by consumers in this market when this excise tax is imposed.
III. When this excise tax is imposed consumers find that they pay $2 more per gallon of gasoline.
IV. The government "captures" some of the consumer tax incidence as well as some of the producer tax incidence when it implements this excise tax.
a. Statements I and II are both true.
b. Statement I is true.
c. Statement III is true.
d. Statements III and IV are both true.
Problem 15. Consider the excise tax described in this last problem. When this excise tax is implemented, the deadweight loss due to this excise tax equals:
a. $3
b. $6
c. $1.50
d. $2.50
Problem 16. The graph below depicts the market supply curve for popsicles. This market has only two producers, Sweet Licks and Frozen Delight. You are told that Frozen Delight is able to supply popsicles at a lower price than can Sweet Licks.
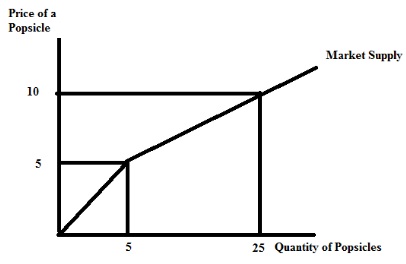
Based upon the above information and the provided graph, what is the equation for Sweet Licks' supply curve for popsicles?
a. P = (1/4)Q + 5
b. P = (1/4)Q + (15/4)
c. P = 5 + (1/3)Q
d. P = (1/3)Q
Use the information below for the next four (4) questions.
The market demand and market supply curves for the wheat market in Visalia are given by the following equations where P is the price per bushel and Q is the number of bushels of wheat:
Market Demand: P = 10 – (1/100)Q
Market Supply: P = 2 + (1/100)Q
Problem 17. Suppose this market is in equilibrium. Then, the value of total surplus in this market is:
a. $800
b. $3200
c. $2400
d. $1600
Problem 18. Suppose that the government decides to impose a price subsidy program in this market. This program costs the government $4200. Given this information and holding everything else constant, what was the value of the subsidy per bushel of wheat?
a. $9 per bushel of wheat
b. $3 per bushel of wheat
c. $6 per bushel of wheat
d. $7 per bushel of wheat
Problem 19. Return to the initial scenario. Suppose the government imposes a price support program where the price floor is set at $8 per bushel of wheat and the government agrees to purchase any surplus bushels of wheat. With this program, wheat farmers will produce ____ bushels of wheat, the government will purchase ___ bushels of wheat, and consumers will purchase ___ bushels of wheat.
a. 600; 400; 200
b. 600; 200; 400
c. 600; 300; 300
d. 400; 200; 200
Problem 20. Consider the program described in the last question. Suppose that storage costs for wheat are $10 per bushel of wheat per year. What is the total cost of this price support program to the government if the program as described is implemented for two years and if there are no changes to the program and everything else is held constant?
a. $14,400
b. $18,400
c. $6400
d. $11,400
Use the figure below to answer the next question. Treat this figure as drawn to scale. This is a bit of a "thought experiment"! So, as a hint: think about this one a bit.
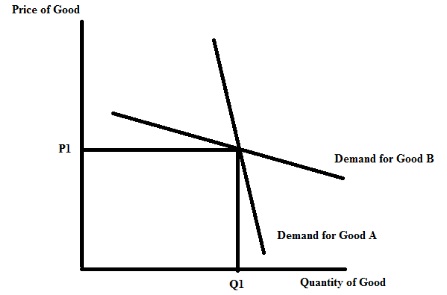
Problem 21. Consider the two demand curves in the above figure.
As shown, one of them is the demand curve for Good A and one is the demand curve for Good B. Currently the price of Good A and the price of Good B is P1. Suppose the sellers of these two goods are considering reducing the prices of their products by 10% in a spring sale.
Which of the following statements is true?
a. A price reduction of 10% in the market for good A will increase firm revenue while a price reduction of 10% in the market for good B will decrease firm revenue.
b. A price reduction of 10% in the market for good A will decrease firm revenue while a price reduction of 10% in the market for good B will increase firm revenue.
c. A price reduction of 10% in either the market for good A or the market for good B will result in a reduction in each firm's revenue.
d. A price reduction of 10% in either the market for good A or the market for good B will result in an increase in each firm's revenue.
Use the figure below to answer the next question.
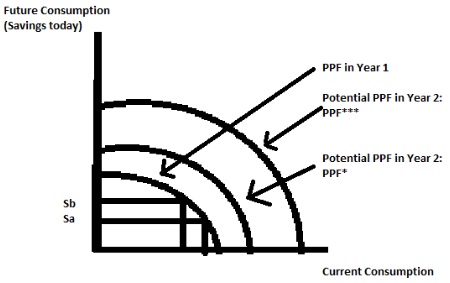
Problem 22. In the above figure, PPF in Year 1 shows the PPF for an economy in a given year. During this year the people in this economy can make a choice of saving the amount Sa to invest to raise future consumption or they can instead choose a higher amount of savings in year 1 shown as Sb. The PPF for year 2 could be at PPF* or at PPF*** as shown in the diagram depending on whether people save Sa or Sbin Year 1.
Given this information, if people in the economy choose the amount of savings shown as _____ in Year 1, then the PPF in year 2 will be _____.
a. Sa, PPF***
b. Sb, PPF***
c. Sb, PPF*
d. It is not possible to reach PPF*** with either choice!
Use the figure below and the following information to answer the next three (3) questions.
Joe and Susie both produce ornaments and notepads and they both have linear PPFs. You are told that Joe can produce 20 ornaments and zero notepads or he can produce zero ornaments and 30 notepads from his available resources, technology or time. Susie can produce either 10 ornaments and 5 notepads or 5 ornaments and 10 notepads from her available resources, technology or time.
Problem 23. Given this information and holding everything else constant, you know that:
a. Joe has the absolute advantage in the production of both goods, and Susie has the comparative advantage in the production of ornaments.
b. Joe has the absolute advantage in the production of notepads and Susie has the comparative advantage in the production of notepads.
c. Susie has the comparative advantage in the production of notepads and Joe has the comparative advantage in the production of ornaments.
d. Susie has the absolute advantage in the production of ornaments and Joe has the comparative advantage in the production of notepads.
Problem 24. Given this information and holding everything else constant, you know that the "kink" point on the joint PPF is:
a. (20 ornaments, 15 notepads)
b. (30 ornaments, 15 notepads)
c. (15 ornaments, 30 notepads)
d. (15 ornaments, 20 notepads)
Problem 25. If Joe and Susie decide to specialize and then trade with one another, then:
a. Susie is willing to accept (20/3) ornaments or less for 10 notepads.
b. Susie is willing to pay 10 ornaments or more for 10 notepads.
c. Joe is willing to accept (20/3) ornaments or more for 10 notepads.
d. Joe is willing to pay 10 ornaments or less for 10 notepads.
Use the following information to answer the next three (3) questions. Suppose there exists a market for flat-screen TVs. Demand comes from two types of customers: rich customers and poor customers, who have demand curves given by the following equations where P is the price per flat-screen TV and Q is the quantity of flat-screen TVs:
Rich customer demand: PRich = 1000 – Qrich
Poor customer demand: Ppoor = 200 – (1/2)QPoor
Supply is made up of two firms, RCA Victor and Sonyhype, which have supply curves given by:
RCA Victor: QRCAVICTOR = P – 100
Sonyhype: P = (1/2)QSPNYHYPE + 200
Problem 26. Given the above information and holding everything else constant, if the price of a flat-screen TV was $150, how many flat-screen TVs would be demanded in this market?
a. 850 flat-screen TVs
b. 200 flat-screen TVs
c. 950 flat-screen TVs
d. 1000 flat-screen TVs
Problem 27. Suppose that the price of a flat-screen TV is $150 per TV. Given this information, what is the value of consumer surplus?
a. $363,750
b. $412,500
c. $366,250
d. $540,000
Problem 28. Now suppose that the market is allowed to find the equilibrium price. At the market equilibrium the price is ____, richconsumers buy _____ flat-screen TVs and poor consumers buy _____ flat-screen TVs.
a. $375 per flat-screen TV; 625 flat-screen TVs; 0 flat-screen TVs
b. $200 per flat-screen TV; 800flat-screen TVs; 0 flat-screen TVs
c. $150 per flat-screen TV; 8500 flat-screen TVs; 150 flat-screen TVs
d. $200 per flat-screen TV; 200 flat-screenTVs; 175 flat-screen TVs
Problem 29. Demand and supply for gadgets are given by the following equations where P is the price per gadget in dollars and Q is the quantity of gadgets:
Demand for gadgets:
P = 300 – Q
Supply of gadgets: P = 2Q
Suppose the government imposes a price ceiling of $60 in this market? What is the "short" side of the market given this price ceiling and how much deadweight loss would be caused by the government imposing this price ceiling?
a) the demand side; $0
b) the supply side; $450
c) the demand side; $7200
d) the supply side; $7350
Use the figure below to answer the next question. The figure depicts a market for a good.
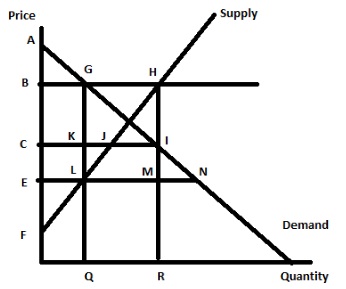
Problem 30. Suppose that the government decides to implement a price guarantee program in the above market. If the guaranteed price is set at "B", then what area represents the cost to the government of this program?
a. Area BHME
b. Area BHIC
c. Area GHIK
d. Area GHRQ
III. PROBLEMS (2 problems)
1.1. Consider the market for bicycles in the small closed economy of Circleville. The domestic demand and domestic supply curves for bicycles are given by the following equations where P is the price per bicycle and Q is the quantity of bicycles.
Domestic Demand: Q = 200 – 2P
Domestic Supply: Q = (2/3)P
a. Given the above information calculate the value of consumer surplus (CS) and producer surplus (PS) if this economy is closed to trade. Show your work.
CS = ____________
PS = ____________
b. Suppose the world price of bicycles is $36 per bicycle and that Circleville opens its bicycle market to trade. In the space below calculate the value of consumer surplus (CSwithtrade) and producer surplus (PSwithtrade) when this economy opens this market. Show your work.
CSwithtrade = ________
PSwithtrade = ________
c. Suppose that Circleville opens this market to trade when the world price of bicycles is $36 per bicycle. At the same time the government of Circleville imposes a tariff that raises the prices of bicycles in Circleville to $63. Answer the following questions, given this information. Show your work in the space provided.
i. How many bicycles will Circleville import?
ii. How many bicycles will be produced by domestic producers given this tariff?
iii. How much tariff revenue will the government earn with the imposition of this tariff?
d. From class discussion we know that the imposition of a tariff creates two kinds of deadweight loss. Given the tariff described in (d), calculate the value of the deadweight loss due to the decision to impose a policy that results in the less efficient domestic producers producing more of the good. Show your work.
DWL due to less efficient domestic producers producing more of the good = ______.
2. Betty and Morgan both produce maps (M)and compasses (C). They both have linear production possibility frontiers and you are also told that Morgan has the comparative advantage in the production of compasses. The figure below depicts Betty and Morgan's joint PPF per year if they specialize according to comparative advantage.
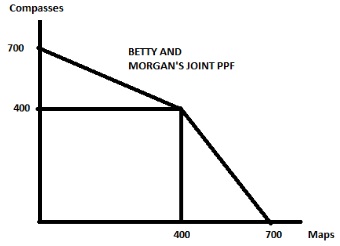
a. In the space below draw Morgan's PPF based upon the above information and figure. Make sure your graph is completely and carefully labeled.
2. Betty and Morgan both produce maps (M) and compasses (C). They both have linear production possibility frontiers and you are also told that Morgan has the comparative advantage in the production of compasses. The figure below depicts Betty and Morgan's joint PPF per year if they specialize according to comparative advantage.
a. In the space below draw Morgan's PPF based upon the above information and figure. Make sure your graph is completely and carefully labeled.
b. Write an equation in slope-intercept form (where compasses are the variable measured on the vertical axis) for Betty's PPF using M as the symbol for maps and C as the symbol for compasses.
c. Write an equation in slope-intercept form for Morgan's PPF using M as the symbol for maps and C as the symbol for compasses.
d. In the space below write the equation(s) for the joint PPF. For any equation provided make sure you identify the relevant range for the equation.
e) Suppose that Morgan and Betty specialize and together they produce 600 compasses. Assume that they are producing on their joint PPF. Given this information answer the following questions:
i. How many compasses will Morgan produce?
ii. How many compasses will Betty produce?
iii. How many maps will Morgan produce?
iv. How many maps will Betty produce?
What is the trading range of prices for 180 maps? Use the number line approach to display your answer and in your answer indicate both Morgan and Betty's perspectives with regard to this range of trading prices.