Question 1:
a) If X is a Poisson variate and p(X = 3) > p(X = 2) then find out the minimum value of mean.
b) Ten individuals are selected at random, from a normal population and their weights (in kg) are found to be 63, 63, 66, 67, 68, 69, 70, 70, 71 and 71. In the light of this data set, test the claim that the mean weight in population is 66 kg at 5% level of significance.
c) I bought two packets of apples, 25 in each packet. The mean and standard deviation of weights of apples in the first packet are 235 and 3; and the mean and standard deviation for the second packet are 237.5 and 4. Write the mean and standard deviation formulae for all the fifty apples and calculate them.
Question 2:
a) A consumer research organization tests three brands of tires to see how many miles they can be driven before they must be replaced. One tire of each brand is tested in each of five kinds of cars. The results (in thousands of miles) are as shown below:
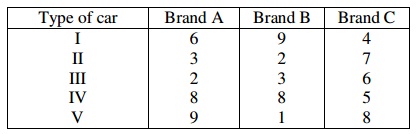
Calculate the ANOVA and interpret your result. You might like to use the values given at the end.
b) Does each of the given statements pertain to an estimate or an estimator? If the statements pertains to an estimate is it an interval estimate or point estimates? If the statement pertains to an estimator write the estimator.
i) The head of a publishing company states that the firm’s physics textbook will sell around 9000 copies in 2012.
ii) A census prefers the median to the mean as a measure of central tendency for the income distribution of families in a standard metropolitan city.
iii) A stock market analyst who appears on the television program estimates that the price of a specific common stock will be between 50 and 60 at the end of six months.
Question 3:
a) What are the fundamental components that have an effect on the characteristic under consideration in the given time series data? Give short justification for your answer.
Number of cars produced month-wise by a car manufacturing company throughout April 2001 to March 2009.
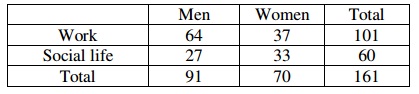
b) In the study of how employed people spend their time. 161 people were asked what activity they liked most. The given table shows the number of employed men and women who mentioned work or social life as their favored activity.
Question 4:
a) A building has 11 flats. The sample of 4 flats is to be selected by using:
i) Linear systematic sampling.
ii) Circular systematic sampling.
List out all the possible samples for each of such cases separately.
b) Determine the area under the curve between 10 and 12 for a normal process with mean 6 and standard deviation 4.
c) There are 1000 pages in a book out of which 100 pages are defective. Find out the probability that out of first 50 pages 10 pages will be defective?
Question 5:
a) A class of 10 students underwent a mathematics examination. The principal was interested in seeing the performance of the students with respect to their attendance in a semester. Data is as shown below:
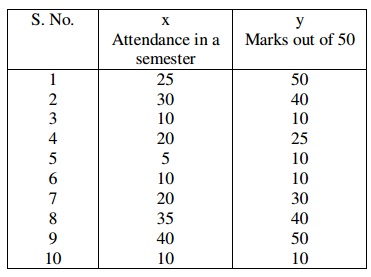
i) Plot the scatter diagram.
ii) Draw the Regression line of y on x.
iii) Find out the predicted marks if a student attends 32 classes in a semester.
b) The number of defects in 20 pieces of cloth each of 100 meter length is shown below:
2, 1, 3, 3, 1, 6, 4, 3, 7, 10, 2, 2, 6, 4, 3, 2, 1, 5, 6, 4.
Draw the suitable control chart and interpret the outcome.