Response to the following problem:
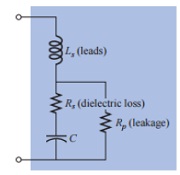
Plot the total impedance of the configuration of Fig. versus frequency (100 kHz to 100 MHz) for the following parameter values C=0.1 μF,Ls=0.2 μH,Rs=2MΩ and Rp= 100 MΩ. For what frequency range is the capacitor "capacitive"?