Solve the following problem:
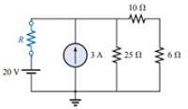
a. Using schematics, plot the power delivered to the resistor R of Fig. for R having values from 1 Ω to 50 Ω.
b. From the plot, determine the value of R resulting in maximum power to R and the maximum power to R.
c. Compare the results of part (a) to the numerical solution.
d. Plot VR and IR versus R, and find the value of each under maximum power conditions.