Discuss the below in detail:
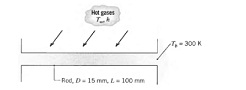
Q: A support rod (k = 15 W/m · K, a = 4.0 X 10⁻⁶ m2/s) of diameter D = 15 mm and length L = 100 mm spans a channel whose walls are maintained at a temperature of Tb = 300 K. Suddenly, the rod is exposed to a cross flow of hot gases for which T? = 600 K and h = 75 W/m2 · K. The channel walls are cooled and remain at 300 K.
(a) Using an appropriate numerical technique, determine the thermal response of the rod to the convective heating. Plot the mid span temperature as a function of elapsed time. Using an appropriate analytical model of the rod, determine the steady-state temperature distribution and compare the result with that obtained numerically for very long elapsed times.
(b) After the rod has reached steady-state conditions, the flow of hot gases is suddenly terminated, and the rod cools by free convection to ambient air at T? = 300 K and by radiation exchange with large surroundings at Tsur = 300 K. The free convection coefficient can be expressed as h (W /m2 · K) = CTn, where C = 4.4 W/m2 · K1.188 and n = 0.188. The emissivity of the rod is 0.5. Determine the subsequent thermal response of the rod. Plot the mid span temperature as a function of cooling time and determine the time required for the rod to reach a safe-to-touch temperature of 315 K.