The objectives of this exercise:
1. To perform multiple regression with real financial data.
2. To estimate the Fama - French 3-factor model for a list of twenty stocks and interpret the regression output.
3. To discern whether individual stocks are small, mid or large cap and value, neutral or growth.
Learning Outcomes:
Students should be able to:
1. Perform Ordinary Least Squares regression to estimate the Fama - French 3-factor model.
2. Perform proper inference with correct interpretation of t-statistics.
3. Discern whether a stock return significantly loads on one or more of the three factors.
4. Tabulate regression results and discuss empirical findings.
Guidelines:
1. You will be assigned twenty (20) stocks from the current S&P 500 index. You must use the same 20 stocks (or, more precisely, the ticker symbols) you used for Project 1. The last month of return data should be September 2014.You must use end-of-month data!
2. You must estimate the Fama and French 3-factor model. Thirty-six months of the three factors along with the risk-free-rate in decimal form will be provided in the accompanying Excel spreadsheet. Use these factors and the risk-free rate provided to you. The factors are MRP (BKM call this RM), SMB and HML. Note, you need excess returns for your stocks. Estimating the Fama and French 3-factor model requires the use of regression software. Answer the following question:
a.How, exactly, do Fama and French construct their SMB and HML factors?
3. For each firm, perform a multiple regression to estimate the parameters in equation (10.11) of BKM 9thed. Then complete a Table:
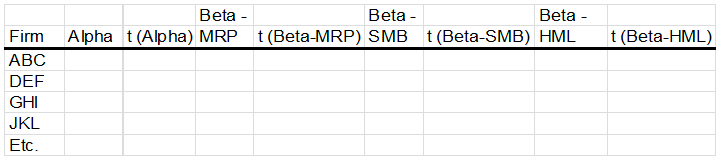
Note that t(Alpha) above means the t-statistic for the alpha estimate and that t(Beta-MRP) means the t-statistic for the beta coefficient estimated for the MRP factor, etc.
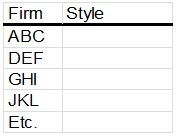
4. Then, using the results from your multiple regressions, identify the "style" for each of your 20 firms. In your write-up, be sure to explain how you identified the various styles. Styles include Large-Neutral, Large-Value, Large-Growth, Mid-Neutral, Mid -Value, Mid-Growth, Small-Neutral, Small-Value, Small-Growth:
Output:
You must submit a brief write-up of your results. Your paper should be detailed enough so that someone else could pick up your paper and replicate your results. So, you will need a brief introduction describing your data sources, how you manipulated the data, how you calculated the Fama-French betas, 2 Tables, and a brief summary and discussion of your findings. In total, you must submit:
1. Your write-up as a Word file.
2. An Excel spreadsheet (one sheet) containing the two Tables detailed above.
3. Another Excel spreadsheet detailing how, exactly, you calculated the results in your Table (i.e., replicate the detailed findings for your stocks). Note that the Excel spreadsheets in points 2 and 3 should be in one file with two different labeled worksheet tabs. Alternatively, you may use 20 Excel sheets named with the ticker symbol if you wish to combine the date, ticker symbol, adjusted closing prices, and calculations and/or regressions separately for each of your 20 companies.