GDP Measurement
Problem 1. Suppose that Republic of Economists produces three goods: books, magazines and papers. The following table provides information about the prices and output for these three goods for the years 2013, 2014 and 2015 .
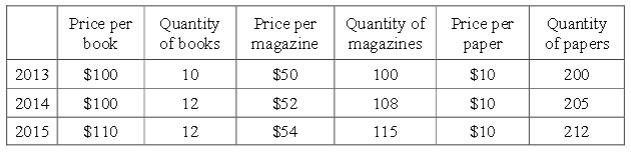
a. Using the provided information, fill in the following table.
Year Nominal GDP
2013
2014
2015
b. What is the percentage change in nominal GDP from 2013 to 2014 ? Provide any formulas you use and show your work in calculating this answer.
c. What was the percentage change in nominal GDP from 2014 to 2015 ?
d. Using 2013 as the base year, fill in the following table.
Year Real GDP
2013
2014
2015
e. What was the percentage change in real GDP from 2013 to 2014 ?
f. What was the percentage change in real GDP from 2014 to 2015 ?
g. Using 2013 as the base year, fill in the following table
Year GDP deflator measured on a 100-point
scale with 2013 as the base year
2013
2014
2015
Problem 2. The Organization for Economic Co - operation and Development (OECD) annually publishes National Accounts of OECD Countries . This annual publication consists of two issues, the first covering main aggregates and t he second detailed tables. These publications cover : expenditure - based GDP (what we called Method 2 or the Expenditure Approach when discussing GDP meas urement) , output - based GDP (what we called Method 1 when discussing GDP measurement) , income - based GDP (what we called Method 3 or the Income Approach when discussing GDP measurement) , disposable income, saving and net lending, population, employment, and final consumption expen diture of households by purpose. The publications also include simplified accounts for the three main sectors of an country's economy: general government, c orporations and households. The publications also include comparative tables based on purchasing power parities and exchange rates for different countries . Data are shown for 34 OECD countries and the Euro area. Figures provided in the c ountry tables are expressed in the country's national currency. Use the link below to answer the following set of questions: https://www.oecd - ilibrary.org/economics/national - accounts - of - oecd - countries_2221433x
(You have a free access to the link since UW - Madison has a subscription for its students and researchers. HOWEVER, yo u must be on camp us when downloading the reports and this IMPLIES THAT YOU WILL NEED TO PLAN AHEAD! ) The expenditure approach tells us that
GDP = Consumption + Investme nt + Government S pending + Net E xports or, symbolically:
GDP = C + I + G + (X - IM) Let’s verify wheth er the above identity or equation is true for South Korea’s (in the tables and henceforth in this problem we will simply refer to "Korea") national accounts .
a. Fill the blanks of the table below (in billion KRW & at current prices) :

b. Fill the blanks of the table below (in billion KRW & at constant prices with 2010 the base year or reference year ):
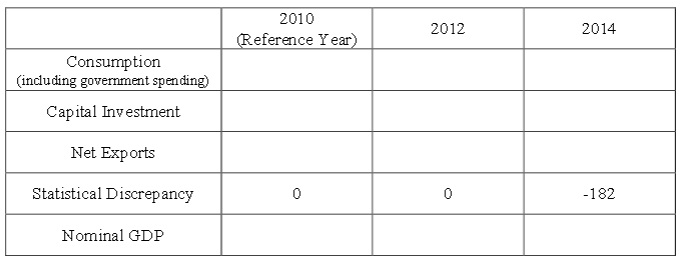
c. Calculate Korea’s GDP deflators for the year of 2010, 2012 and 2014 (using a 100 - point scale and with 2010 the base year or reference year ) :
2010 2012 2014
(Reference Year)
GDP deflator
d. Calculate the biannual growth rates (biannual is every two years) of Korea’s real GDP (in percentage):
2010 2012 2014
(Reference Year)
Growth rate of
GDP deflator
Real GDP vs. Nominal GDP
Problem 3. The following table includes data showing US GDP and inflation for the past ten years. The n ominal and real GDP series in this table are taken from the US Bureau of Economic Analysis ( https://www.bea.gov/national/index.htm#gdp ), while the last column in the table is calculated from CPI data provided at the US Bureau of Labor Statistics ( https://data.bls.gov/cgi - bin/surveymost?bls , CPI for All Urban Consumers (CPI - U) 1982 - 84 =100 (Unadjusted) - CUUR0000SA0 ). You are encouraged to use exc el or other software to do the following calculations.
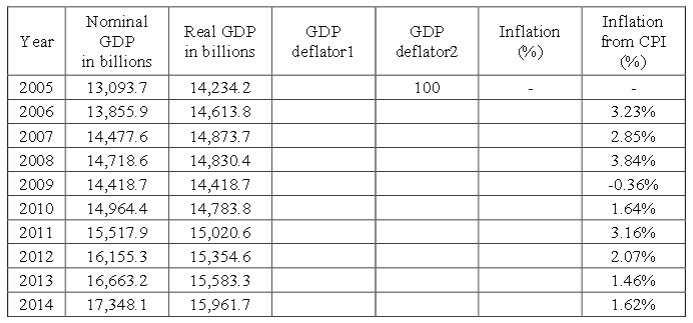
a. According to the table above, which year is used as the base year in calculating real GDP? Explain your answer.
b. Using the formula for the GDP deflator given in class, calculate the GDP deflator for the last ten years and fill out the column labeled GDP deflator1. Calculate this GDP deflator using a one - point scale.
c. Now we want to redefine the base year and make 2005 the new base year. When we do this the GDP deflator in 2005 will have a value of 100 on a 1 00 point scale. Use your answer s from part (b ), GDP deflator 1, to fill out the column labeled as GDP deflator 2. Note: not only do we want you to change the base year, we also want you to change the scale from a one - point scale to a 100 - point scale.
d. Define inflation as the % change in the general price level; review your class notes for the general formula for the % change in the general price level. Calculate the annual inflation rate for the last ten years based upon the GDP deflator and fill out the column labeled inflation. Compare your calculation of the inflation rate using the GDP deflator to the measure of inflation provided by the CPI (see the column labeled “inflation from CPI”). Are these two measures of inflation equal? Why or why not?
Unemployment Measurement
Question 4. The table below provides data on US employment taken fro m US Bureau of Labor Statistics (in thousands)
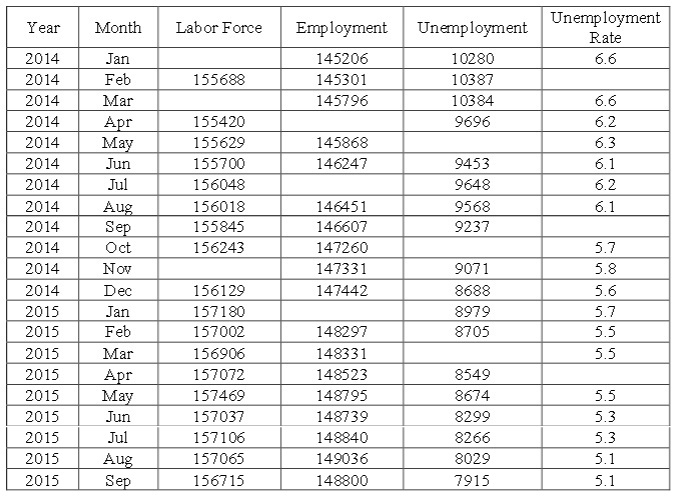
a. Fill in the missing numbers in the table . Provide any formulas you need to use in filling out the missing values as well.
b. According to the US Census Bureau, the US has a population of about 320 million people. Why is the labor force in the above table only about 160 million people? Which groups of people are not included in the labor force? List at least four groups of people that are excluded from the labor force . Suppose that the Republic of Economists (ROE) is a country which has exactly the same values for their labor force, their employment and their unemployment as the US in September 2015. Among those 7915 unemployed workers in the ROE, 2000 of these unemployed workers are temporarily laid - off workers and newly graduated students who expect to find a new job soon, while 1800 of these unemployed workers are searching for jobs in the market where there are few vacancies due to the type of job that is being sought.
c. Given this information, what is the structural unemployment rate in ROE ? What is the frictional unemployment rate in ROE ? What is the cyclical unemployment rate in ROE ? What is the natural unemployment rate in ROE ? For each answer show the formula you use and th e numeric values you entered in that formula when computing your answer (don't just provide a final number!).
CPI
Question 5. Suppose that the market basket for purposes of computing the consumer price index (the CPI) in Madison contains 2 books, 10 steaks, 20 potatoes, 5 cookies, and 2 bags of charcoal. You are given the following price data for the year s 2005 through 2010 in Madison .
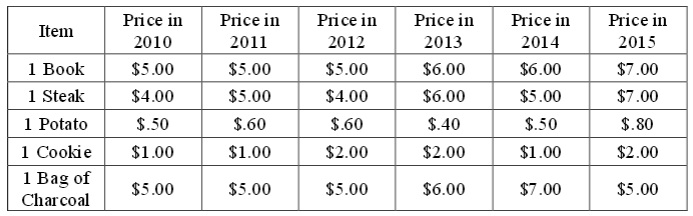
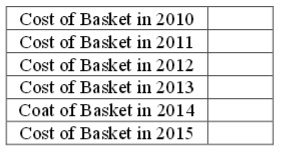
a. Using the above data compute the cost of each market basket. Put your answers in the following table.
b. Now, calculate the CPI for 2010 through 2015 using 2010 as the base year. Enter your results in the following table. Use a 100 - point scale for the CPI. Carry your answer out to two places past the decimal.
Year CPI
2010
2011
2012
2013
2014
2015
c. Now, using the answers you got in part (b) calculate the annual rate of inf lation in this economy from 2011 through 2015 . Enter your answers in the table provided. Carry your answer out to two places past the decimal.
Year Rate of Inflation
2010
2011
2012
2013
2014
2015
d. Now, redo the CPI you found in part (b) with 2015 as the base year. Enter your results in the following table. Use a 100 - point scale for the CPI. Carry your answer out to two places past the decimal.
Year CPI
2010
2011
2012
2013
2014
2015
e. Now, using the answers you got in part (d) calculate the annual rate of inf lation in this economy from 2011 through 2015 . Enter your answers in the table provided. Carry your answer out to two places past the decimal.
Year Rate of Inflation
2010
2011
2012
2013
2014
2015
f . Compare the annual rate s of inflation in part (c) and (e). Are they the same or different? Explain your answer