Discuss the folllowing:
Q1- Use the data below:
For each of the variables - Gender, Miles from College to Home States, and Capitols You Can Name calculate the following statistics and graphs:
a. Using at most seven classes, organize the sample data into a frequency distribution.
b. Graph out the data for gender in a pie chart and the miles and capitols in a bar chart or histogram.
c. Calculate the mean for each of the 3 variables, use the actual raw data.
d. Calculate the median for each of the 3 variables, use the actual raw data.
e. Calculate the mode for each of the 3 variables, use the actual raw data.
f. Calculate the range for each of the 3 variables, use the actual raw data.
g. Calculate the sample standard deviation for each of the 3 variables, use the actual raw data.
| Gender |
Miles from College to Home |
States & Capitols You Can Name |
| F |
80 |
15 |
| F |
70 |
40 |
| F |
15 |
30 |
| F |
55 |
40 |
| M |
100 |
10 |
| F |
10 |
20 |
| F |
2 |
45 |
| F |
10 |
30 |
| F |
5 |
15 |
| F |
20 |
45 |
| M |
30 |
50 |
| M |
60 |
50 |
| M |
85 |
50 |
| M |
2 |
35 |
| M |
250 |
42 |
| F |
30 |
10 |
| F |
160 |
40 |
| F |
1 |
45 |
| F |
80 |
10 |
| F |
20 |
10 |
| F |
32 |
35 |
| M |
160 |
32 |
| M |
1.5 |
30 |
| F |
84 |
25 |
| F |
17 |
50 |
| F |
150 |
50 |
| M |
150 |
30 |
| M |
150 |
5 |
| M |
30 |
40 |
| M |
60 |
50 |
| M |
120 |
50 |
| F |
50 |
25 |
| M |
80 |
40 |
| F |
75 |
48 |
| M |
40 |
32 |
| F |
6 |
5 |
| M |
200 |
25 |
| F |
5 |
30 |
| F |
7.5 |
10 |
| F |
20 |
25 |
| M |
7 |
20 |
| M |
20 |
45 |
| F |
1 |
25 |
| F |
15 |
25 |
| M |
150 |
15 |
Q2 - Refer to the following diagram.
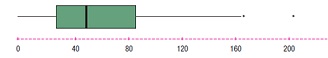
a. What is the graph called?
b. What are the median, and first and third quartile values?
c. Is the distribution positively skewed? Tell how you know.
d. Are there any outliers? If yes, estimate these values.
e. Can you determine the number of observations in the study?
Q3 - Use the data below:
a. Using the scatter plot feature in Excel, graph out Miles versus States Named.
b. Run the regression analysis to determine if the is a relationship between Miles and States, is Miles a good predictor of the number of States and Capitals that a student can name? Is this a significant regression equation?
c. What is your prediction for the number of States and Capitals that can be named given that I told you that the student lived just 10 miles from College?
| Gender |
Miles from College to Home |
States & Capitols You Can Name |
| F |
80 |
15 |
| F |
70 |
40 |
| F |
15 |
30 |
| F |
55 |
40 |
| M |
100 |
10 |
| F |
10 |
20 |
| F |
2 |
45 |
| F |
10 |
30 |
| F |
5 |
15 |
| F |
20 |
45 |
| M |
30 |
50 |
| M |
60 |
50 |
| M |
85 |
50 |
| M |
2 |
35 |
| M |
250 |
42 |
| F |
30 |
10 |
| F |
160 |
40 |
| F |
1 |
45 |
| F |
80 |
10 |
| F |
20 |
10 |
| F |
32 |
35 |
| M |
160 |
32 |
| M |
1.5 |
30 |
| F |
84 |
25 |
| F |
17 |
50 |
| F |
150 |
50 |
| M |
150 |
30 |
| M |
150 |
5 |
| M |
30 |
40 |
| M |
60 |
50 |
| M |
120 |
50 |
| F |
50 |
25 |
| M |
80 |
40 |
| F |
75 |
48 |
| M |
40 |
32 |
| F |
6 |
5 |
| M |
200 |
25 |
| F |
5 |
30 |
| F |
7.5 |
10 |
| F |
20 |
25 |
| M |
7 |
20 |
| M |
20 |
45 |
| F |
1 |
25 |
| F |
15 |
25 |
| M |
150 |
15 |
Q4 - The following data shows the retail price for 12 randomly selected laptop computers along with their corresponding processor speeds.
a. Develop a linear equation that can be used to describe how the price depends on the processor speed.
b. Based on your regression equation, is there one machine that seems particularly over- or underpriced?
c. Compute the correlation coefficient between the two variables. At the .05 significance level conduct a test of hypothesis to determine if the population correlation could be greater than zero.
|
Computers
|
Speed
|
Price
|
|
1
|
2.0
|
$2,689
|
|
2
|
1.6
|
1,229
|
|
3
|
1.6
|
1,419
|
|
4
|
1.8
|
2,589
|
|
5
|
2.0
|
2,849
|
|
6
|
1.2
|
1,349
|
|
7
|
2.0
|
2,929
|
|
8
|
1.6
|
1,849
|
|
9
|
2.0
|
2,819
|
|
10
|
1.6
|
2,669
|
|
11
|
1.0
|
1,249
|
|
12
|
1.4
|
1,159
|
Q5 - A wireless phone service charges $14.99 as a monthly charge and $0.30 per minute for local calls.
a. How much would you pay in a month when you made ten local calls of three minutes each?
b. Let C represent your total monthly cost; assuming you made only local calls, did not receive any calls, and the total number of minutes you were on the phone is m, write the equation to find your monthly bill.
c. How can you tell that the relationship between C and m follows a linear pattern?
d. Graph the function that gives the total monthly cost and give the slope of the line.