Assignment:
Circularity of the DFT/FFT. Using the same x[n] (shown below):
a) stem(x);
b) Use the shift theorm to plot x delayed by 1, 4, 5, 6, and 8 samples, and plot the result for each. Remember the shift theorem says a delay by t0 seconds is equal to multiplying the spectrum by e-jΩt0. So to do this, do stem(real(ifft( exp(-j*m*t0).*fft(x)))); for the different values of t0. (the real is needed because round-off errors introduce some imaginary values that don't really exist. If you plot the imaginary part you'll see it's ~10-15).
For sequence x[n]=[1 1 1 1 0 0 0 0] for n=0:7, so N=8
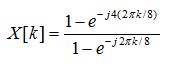
plot X[ω],
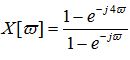
, where
clear all;
close all;
w=0:0.01:2*pi;
%calculated Fourier transform
Xw=(1-exp(-j*4*w))./(1-exp(-j*w));
x=[1 1 1 1 0 0 0 0];
m=(0:7)*2*pi/8;
%plot real part of Xw
plot(w,real(Xw),'LineWidth',2);
hold on;
%plot the real part of fft(x)
stem(m,real(fft(x)),'r','LineWidth',2);
xlabel('\omega','FontSize',16);
ylabel('FFT of x[n]','FontSize',16);
title('Real Part of FFT','FontSize',16);
Provide complete and step by step solution for the question and show calculations and use formulas.