Discuss the below:
1. Indicate which would be the independent variable and which would be the dependent variable in each of the following:
a. Score on the first test, Final grade
b. Gas mileage, Car speed
c. High school grade point average, Freshman College grade point average
d. Crop yield, Rainfall
2. A math test was given with the following results:
80, 69, 92, 75, 88, 37, 98, 92, 90, 81, 32, 50, 59, 66, 67, 66
Find the range, standard deviation, and variance for the scores.
3. For a particular sample of 50 scores on a psychology exam, the following results were obtained.
Mean = 78 Midrange = 72 Third quartile = 94 Mode = 84
Median = 80 Standard deviation = 11 Range = 52 First quartile = 68
a. What score was earned by more students than any other score? Why?
b. How many students scored between 68 and 94 on the exam?
c. What was the highest score earned on the exam?
d. What was the lowest score earned on the exam?
e. How many students scored within three standard deviations of the mean ?
4. Answer the following:
a. What does it mean to say that x = 152 has a standard score of +1.5?
b. What does it mean to say that a particular value of x has a z-score of -2.1?
c. In general, what is the standard score a measure of?
5. A student scored 70 percent on a test, and was in the 80th percentile. Explain these two numbers.
6. An animal trainer obtained the following data (Table A) in a study of reaction times of dogs (in seconds) to a specific stimulus. He then selected another group of dogs that were much older than the first group and measure their reaction times to the same stimulus. The data is shown in Table B.
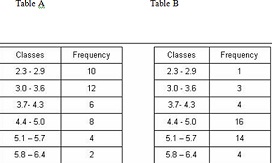
Find the variance and standard deviation for the two distributions above. Compare the variation of the data sets. Decide if one data set is more variable than the other.
7. Answer the following:
a. What is the relationship between the sign of the correlation coefficient and the sign of the slope of the regression line?
b. As the value of the correlation coefficient increases from 0 to 1, or decreases from 0 to -1, how do the points of the scatter plot fit the regression line?
8. Describe in your own words what is meant by "line of best fit".
9. In your own words, state the primary purpose of:
a. linear correlation analysis
b. regression analysis
10. You are given the following data.
|
Number of Absences
|
Final
Grade
|
|
0
|
96
|
|
1
|
91
|
|
2
|
78
|
|
2
|
83
|
|
3
|
75
|
|
3
|
62
|
|
4
|
70
|
|
5
|
68
|
|
6
|
56
|
a. Make a scatter plot for the data.
b. Find the correlation coefficient for the data.
c. Find the equation for the regression line for the data, and predict the final grade of a student who misses 3.5 days