Section A: Large sample estimation
Question 1: A random sample of n = 50 males showed a mean average daily intake of dairy products equal to 756 grams with a standard deviation of 35 grams.
a. Find a 95% confidence interval for the population mean μ.
b. Find a 90% confidence interval for the population mean μ.
c. Find a 92% confidence interval for the population mean μ.
d. Find a 99% confidence interval for the population mean μ.
Question 2: The following table has some information of renting different rooms in three hotels.
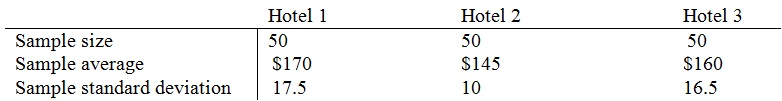
a) Find a 95% confidence interval for the difference in the average of renting between the first and third hotel.
b) Find a 99% confidence interval for the difference in the average of renting between the second and third hotel.
c) Do the intervals in parts aandb contain the value zero?
Question 3: A sample of size 100 measures the amount of money spent on food by U of Windsor students in the past week. The sample given results x ¯= 48.21 with a sample variance of 25. Find an 88% confidence interval for the population mean of the past week’s food expenditure of all 14,000 University of Windsor students. Interpret the confidence interval.
Question 4: A random sample of size n1 = 16 is selected from a normal population with a mean of 75 and a standard deviation of 8. A second random sample of size n1 = 9 is taken from another normal population with mean 70 and standard deviation 12. Find a 95% confidence interval for μ1 - μ2 and interpret the confidence interval.
Question 5: A random sample of 50 suspension helmets used by motorcycle riders and automobile race-car drivers was subjected to an impact test, and 18 of these helmets failed to pass the impact test.
a) Find a 99% confidence interval for the true proportion of helmets of this type that would fail the impact test.
b) Find a 90% confidence interval for the true proportion of helmets of this type that would pass the impact test.
Question 6: An experiment was conducted to test the effect of a new drug on a viral infection. The infection was induced in 100 mice, and the mice were randomly split into two groups of 50. The first group, the control group, received no treatment for the infection. The second group received the drug. After a 30-days period, the proportions of survivors pˆ1, pˆ2 in the two groups were found to be 0.36 and 0.60 respectively.
a) Use a 98% confidence interval to estimate the actual difference in the cure rates for the treated versus the control group.
b) Is there sufficient evidence to indicate that the drug is effective in treating the viral infection?
Question 7: In a study to compare the effects of two pain relievers, it was found that of n1 = 200 randomly selected individuals instructed to use the first pain reliever, 93% indicated that it relieved their pain. Of n2 = 450 randomly selected individuals instructed to use the second pain reliever, 96% indicated that it relieved their pain.
a) For these two pain relievers, find a 99% confidence interval for the difference in the proportions of participants experiencing relief from pain.
b) Based on the confidence interval in part a), is there sufficient evidence to indicate a difference in the proportions of participants experiencing relief from pain? Explain.
Question 8: Independent random samples of n1 = 800 and n2 = 640 observations were selected from binomial populations 1 and 2, and x1 = 337 and x2 = 374 successes were observed. Find a 90% confidence interval for the difference (p1 - p2) in the two population proportions. Interpret the interval.
Section B: Large sample tests of hypotheses
Question 1: The researcher wishes to show that the average hourly wage of clerical workers in the province of the New Brunswick is different from $14, which is the national average. What would be the alternative and null hypothesis?
Question 2: A milling process currently produces an average of %3 defectives. You are interested in showing that a simple adjustment on a machine will decrease p, the proportion of defectives produced in milling process. What would be the alternative and null hypothesis?
Question 3: Random samples of n = 35 observations from a quantitative population produced a mean 2.4 and a standard deviation 0.29. Suppose your research objective is to show that the population mean μ exceeds 2.3.
a) Conduct the test of hypothesis and state your conclusion. Use α= .05.
Question 4: A random samples of 130 human body temperatures were taken and had a mean 36.81 Centigrade and standard deviation of 0.73 Centigrade. Does the data indicate that the average body temperatures for healthy humans are different from 37 Centigrade?
a) Conduct the test of hypothesis and state your conclusion Use α= .05.
Question 5: Independent random samples of 80 measurements were drawn from two (quantitative) populations, 1 and 2. Suppose your research objective is to show that μ1 is larger than μ2.
Sample 1 Sample 2
Sample size 80 80
Sample mean 11.6 9.7
Sample variance 27.9 38.4
a) Calculate the test statistic that you would use for this claim. Use α= 0.01.
Question 6: In an attempt to compare the starting salaries for university graduates who majored in education and the social sciences, a random sample of 50 recent universities in each major were selected and following information was obtained:
Major Mean Standard deviation
Education 40,554 2225
Social sciences 38,348 2375
a) Do these data provide sufficient evidence to indicate adifference in average starting salaries for university graduates who majored in education and the social sciences? Test using α = .05.
b) Find the 0.95% confidence interval for μ1 - μ2.
c) Compare the results in part a and b.
Question 7: A random sample of n = 1000 observationsfrom a binomial population produced x = 279.
a) If your research hypothesis is that p is less than .3,what should you choose for your alternative hypothesis? For your null hypothesis?
b) What is the critical value that determines the rejectionregion for your test with α = .05?
c) Do the data provide sufficient evidence to indicatethat p is less than .3? Use a 5% significance level.
Question 8: Given the amount of media coverage on the Avian Flu issue, it is not surprising to find that about 60% are concerned about it. However, the concern is fairly modest, only 19% being "very concerned”, but this suggests that concern has the potential to grow as events unfold. The above result is based on the report to the Globe and Mail and CTV from the strategic counsel, 2005. Suppose a random sample of 90 people is selected in 2007. Of these people, 20 are "very concerned' and 50 are "concerned' about the issue.
a) Do the sample data provide sufficient evidence to indicate that the proportion of very concerned is different from 19%? Use α = .05.
b) Do the sample data provide sufficient evidence to indicate that the proportion of concerned is different from 60%? Use α= .05.
c) Is there any reason to conduct a one-tailed test for either part a or b? Explain.
Question 9: Independent random samples of n1= 140 and n2 = 140 observations were randomly selected from binomial populations 1 and 2, respectively. Sample 1 had 74 successes, and sample 2 had 81 successes.
a) Suppose you have no preconceived idea as to which parameter, p1 or p2, is the larger, but you want to detect only a difference between the two parameters, if one exists. What should you choose as the alternative hypothesis for a statistical test? For the null hypothesis?
b) Calculate the test statistic you would use for the test in part a) and state your conclusion. Use α = 0.01.
Question 10: A company has two plants A and B. A manager wants to know if the proportion of products broken at plant A is smaller than at plant B. 100 observations are made at each plant. Atplant A, there are 30 broken items and at plant B there are 44 broken items.
a) Test at α= .05 if the population proportion of items broken at plant A is less than plant B
b) Test at α= .20 whether or not the difference between the population proportion breakage from B and the population proportion breakage from A is 0.10.