Assignment:
Part 1
Description: One of the key contributors to aggregate demand is homeownership. Not only do new homes add to investment spending, but homeownership creates wealth and financial security that lead to greater consumption in the economy. This lab activity compares the rate of homeownership across U.S. states.
Step 1: Acquire the latest available data on homeownership rates from the U.S. Census Bureau (U.S. Department of Commerce):
https://www.census.gov/housing/hvs/data/rates.html. Select the option "Homeownership Rates by State", and open the corresponding Excel spreadsheet. Use the data from the most recent quarter reported.
Step 2: Using data from the Excel spreadsheet, input the five states with the highest homeownership rates and the five states with the lowest homeownership rates. Then take the average homeownership rates from all 51 states (including the District of Columbia) to determine the homeownership rate for the United States.
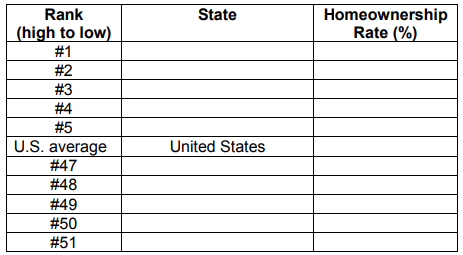
Step 3: Using Excel, enter the data in the table into two columns labeled "State" and "Homeownership Rate (%)", and sort from lowest to highest (Excel requires sorting from lowest to highest to produce a bar graph with the highest entry on top). Then use your mouse to highlight the 24 cells (12 rows including the header row x 2 columns), click the "Insert" tab from the top banner, and under "Charts" select "Insert Bar Chart". Under chart options, select "data labels" to display homeownership rates. Then select the options for the primary horizontal axis and set the minimum bound at 40 and the maximum bound at 80, and major units at 5. Right click the United States bar and select a different color. Finally, copy and paste this chart into your response sheet.
Lab Questions:
1. What is the average homeownership rate of the top five states? What is the average homeownership rates of the bottom five states?
2. What is the difference in homeownership rate between the state with the highest rate of homeownership and the state with the lowest homeownership rate?
3. Analyzing the states that have high and low homeownership rates, what factors explain why these large differences in homeownership between states exist?
Part 2
Description: Aggregate expenditures drive economic activity, and the government is a major source of spending. This lab activity measures the level of government spending in the United States over the last 40 years.
Step 1: Acquire the latest available data on government spending as a percentage of GDP from the Government Publishing Office: https://www.gpo.gov/fdsys/. In the "Search Government Publications" box, enter "total government expenditures as percentages of GDP" and click search. Several Excel spreadsheet options will be shown-select one that includes data from 1976 (or earlier) up to the latest year
possible.
Step 2: Open the Excel spreadsheet and look for "Federal Government Outlays: Total". Input government spending as a percentage of GDP in the table below. Data for the first ten years have already been entered.
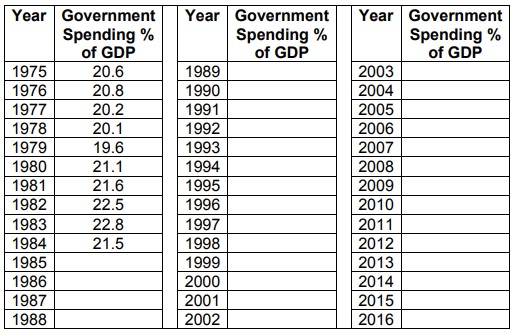
Step 3: Using Excel, enter the data in the table into two columns, and add the title "Spending as Percent of GDP". Do not title the "Year" column. Then use your mouse to highlight the 86 cells (43 rows including the header row x 2 columns), click the "Insert" tab from the top banner, and finally under "Charts" select "Insert Line Chart". Then right click the vertical axis in the chart and select "Format Axis". Under Axis Options, enter "15" for the "Minimum Bound". This will truncate the vertical axis. Copy and paste this chart into your response sheet.
Lab Questions:
1. Which year did government spending as a percentage of GDP reach its highest point? In which year was it at its lowest point?
2. Describe the trend in the chart during times of economic prosperity (such as from 1985 to 1990 and from 1993 to 2000). Describe the trend during economic recessions (such as from 1981 to 1982 and from 2008 to 2009).
3. Explain why the relationship described in Question 2 generally exists.