Problem 1. For each of the following scenarios you will be asked to evaluate the impact of this information on GDP for the economy.
a. Jose works twenty hours a week this year and earns $10 per hour. He takes two weeks of unpaid vacation during the year. Yoshi works thirty hours a week this year and earns $9 per hour. He takes four weeks of unpaid vacation during the year. Both Jose an d Yoshi work in the U.S. What will be the total impact on U.S. GDP this year given this information? Explain how you found your answer and what method of GDP accounting you are using.
b. Century Tires located in the U.S. manufactures 10,000 tires during t he year. Century sells 80% of its tires to Little Car Co. and these tires are put on the new cars being manufactured at the Little Car. Co. Little Car Co. is also located in the U.S. The other 20% of the tires are sold for $100 each as replacement tires in the economy. The new cars being sold by Little Car Co. sell for $10,000 each and they produce 2,000 cars this year. Assume that Little Car Co. sells their new cars with just four tires. What is the contribution to U.S. GDP this year given this information ? Show how you found your answer.
c. Benedita goes to the grocery store in Boston, MA and purchases $135 worth of groceries. In her grocery bags are $25 of German made chocolate (she does love her chocolate!), $35 of Wisconsin cheese, $40 of Iowa - grown po rk and chicken, $20 of California grown fruit, and $15 of Mexican tomatillos. How much did GDP in the U.S. go up this year due to these purchases? Assume that all goods purchased were produced during this year. Fully explain your answer.
d. Jerry goes to the grocery store in New York City, NY and purchases $150 worth of groceries. In his grocery bags are $10 of Wisconsin aged cheddar cheese that has been aged 10 years, $10 of a young German wine that was produced this year, $60 of California - grown fruits and vegetables; $20 of aged Scotch produced in Great Britain and aged for 5 years, and $40 of Iowa - grown chicken and pork. Unless otherwise specified assume that all goods were produced this year. What is the contribution to this ye ar’s U.S. GDP from Jerry’s purchase? Explain your answer fully and for any item that you do not include provide some clear and specific explanation of how this item relates to GDP.
Problem 2. Suppose you are given the following information about an economy. Thi s economy during 2014 could be described as follows:
Item Amount
Rent $25 million
Consumption Spending $185 million
Wages $120 million
Government Spending $15 million
Interest $15 million
Investment Spending $10 million
Trade Deficit -$10 million
When a country has a trade deficit this implies that the value of its imports is greater than the value of its exports.
a. Given the above information, what is the value of GDP for this economy this year? Show how you found your answer and identify the GDP measurement method you are using.
b. Given the above information, what information are you missing in order to use the factor payments approach to measuring GDP? Now that you have calculated GDP in (a), can you find the value of this missing piece of da ta? Show your work!
Problem 3. Suppose you are given the following information about the economy of Grantland. In 2014 Grantland had rent payments of $10 billion, interest payments of $20 billion, consumption spending on goods and services of $120 billion, invest ment spending on goods and services of $40 billion, wages of $100 billion, and net exports of $20 billion. You also know that in Grantland in 2014 that profits were equal to three times the level of government spending on goods and services.
Given this information, calculate the level of GDP in Grantland in 2014. Show how you found your answer. In your calculations you will also need to find the value of profits and government spending on goods and services. Show how you found your answers to each of these values.
Problem 4. Suppose you are given the following information about the Grantland economy:
• The total population in Grantland this year is 5000 people
• 200 people in Grantland are at least 16 years old and have given up looking for work since they do not believe there are any jobs in Grantland for them
• 500 people in Grantland are less than 16 years old
• 200 people in Grantland are fully retired
• 100 people in Grantland are not currently working, they are available to work, but they have not fille d out any job applications during the last four weeks
• 200 people in Grantland are at least 16 years old and are full - time students that are not working and are not interested in working at this time
• there are 200 people in the military in Grantland and they are all at least 18 years old
• there are 600 full - time homemakers in Grantland and they are not working for pay and are not interested in working for pay at this time (they clearly are working at home - but not for pay!)
• there are 1000 part - time wor kers in Grantland and 600 of these workers would like to work full - time but they have been unable to find full - time work
• there are 1000 full - time workers in Grantland a. Given this information what is the civilian labor force? Show how you calculated this value.
b. Given this information, calculate the unemployment rate in Grantland. Show your work.
c. Given this information, suppose Grantland decides to count discouraged workers as part of the unemployed. What will the unemployment rate be in Grantland if the government makes this change in the way they calculate the unemployment rate? Show your work. Round your answer to two place s past the decimal if necessary.
d. Given this information, suppose Grantland decides to count part - time workers who wish t o work full - time but cannot find full - time work as unemployed workers. What will be the unemployment rate be in Grantland if the government makes this change in the way they calculate the unemployment rate? Assume that discouraged workers are given the sta ndard treatment in the calculation of the unemployment rate. Show your work. Round your answer to two place s past the decimal if necessary.
e. Given this information, suppose the government of Grantland reclassifies both discouraged workers and those part - time workers who want full - time work as unemployed workers. (We are combining the changed assumptions of (c) and (d) here.) What will be the unemployment rate given this change in government definitions of unemployment? Show your work. Round your answer t o two places past the decimal if necessary.
Problem 5. In Grantland the standard consumer basket of goods and services for purposes of calculating the CPI is given as two steaks, four potatoes, and five apples. You are given the following information about price s and quantities of these goods in Grantlan
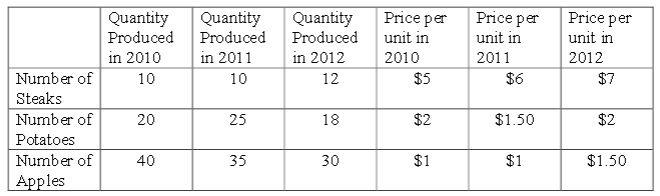
a. Given the above information, calculate the value of nominal GDP in Grantland for 2010, 2011 and 2012. Provide any general formula you use to calculate these values and identify any abbreviations in that formula. Show your work. Enter your final calculations in a table like the one below.
Year Nominal GDP
2010
2011
2012
b. Suppose that you are told that 2010 is the base year. Calculate the values of real GDP in Grantland for these three years. Provide any general formula you use to calculate these values and identify any abbreviations in that formula. Show your work. Enter your calculations in a table like the one below
Year Real GDP with
base year 2010
2010
2011
2012
c. Given your calculations describe what happens to the real level of production in Grantland over these three years. Be specific as to what measures you are going to use when describing this.
d. Suppose that you are told that 2012 is the base year. Calculate the values of real GDP in Grantland for these three years. Provide any general formula y ou use to calculate these values and identify any abbreviations in that formula. Show your work. Enter your calculations in a table like the one below. Do you get the same values for Real GDP when you change the base year?
Year Real GDP with
base year 2012
2010
2011
2012
e. Calculate the GDP deflator using base year 2010 and then repeat this using base year 2012. Show any formulas you use. Place your calculations in the following summary table. Use a 100 point scale for your GDP deflators and round to two places past the decimal . [HINT: to do these calculations use a calculator or a spreadsheet program like EXCEL.]
Year GDP deflator with GDP deflator with
base year 2010 base year 2012
2010
2011
2012
f. Calculate the annual rate of inflation using the GDP deflators with base year 2010 and base year 2012. Do you get the same annual rates of inflation or does choice of base year impact your measure of the inflation rate? Put your calculations in the foll owing summary table. Show how you found your answers.
Annual Rate of Inflation Annual Rate of Inflation
based on GDP deflator with based on GDP deflator with
2010 as the Base Year 2012 as the Base Year
2010 to
2011
2011 to
2012
Problem 6. Let’s continue with the example we started in the last problem. But this time let’s work on calculating the CPI. You will need to go back and find where the basket for purposes of the CPI was defined. And, you will need to return to the initial table to get the data this problem requires.
a. Calculate the cost of the market basket for each of the three years. Show how you calculated these values and then summarize your calculations in the following table
Year Cost of Market Basket
2010
2011
2012
b. Calculate the CPI index using 2010 as the base year. Show how you calculated these values and then summarize your calculations in the following table. Use a 100 - point scale. Calculate your values to two places past the decimal [Hint: use EXCEL or a ca lculator here.]
Year CPI Index using 2010 as the base
year using a 100-point scale
2010
2011
2012
c. Calculate the annual rate of inflation using the CPI index with base year 2010. Show how you calculated these values and then summarize your calculations in the following table.
Annual Rate of Inflation
with Base Year 2010
2010 to 2011
2011 to 2012
d. Calculate the CPI index using 2012 as the base year. Show how you calculated these values and then summarize your calculations in the following table. Use a 500 point scale.
e. Calculate the annual rate of inflation using the CPI index with base year 2012. Show how you calculated these values and then summarize your calculations in the following table.
Year CPI Index using 2012 as the base
year using a 500-point scale
2010
2011
2012
f. Compare the annual rates of inflation you calculated in (c) and (e). Does choice of base year matter when using the CPI to calculate the annual rate of inflation? Does choice of scale factor (in this case 100 - point scale versus 500 - point scale) matter?
Problem 7. [Note: thanks to the website "money.cnn.com/calculator/pf/cost - of - living" for the data that went into this question: data from 1/28/15] Mariyana is looking for a job this year and has three offers from three different location s. Each job is identical to the others and Mariyana only cares about maximizing her purchasing power next year with respect to the job she takes. Her offers are as follows:
Job Location Salary Offered
Denver, CO $103,000
Seattle, WA $108,000
Toledo, OH $100,000
She also knows the CPI for each of these cities
Job Location CPI
Denver, CO 105.677
Seattle, WA 120.617
Toledo, OH 100
a. Given this data, calculate the real salary for next year for each of these cities using Toledo as the base city (i.e. measure the real salaries in terms of Toledo dollars). Show your work. Put your final calculations into the table below. Round your calculations to the nearest whole number .
Job Location Nominal Salary Offered Real Salary using
Toledo Dollars
Denver, CO $103,000
Seattle, WA $108,000
Toledo, OH $100,000 $100,000
b. Given your calculations in (a), and Mariyana's preferences to maximize her purchasing power next year which job should Mariyana take? Explain your answer. What's the important idea behind this exercise?
c. Now suppose that these initial job offers come with projected annual growth rates for the nominal salary values. In Toledo, Mariyana's nominal income will grow by 2% a year; in Denver, her nominal income will grow by 5%a year; and in Seattle, her nominal income will grow by 4%a year. Given this information calculate the nominal values for Mariyana's income in the three cities over the next five years. Here's a table for summarizing your calculations. Round your answers to the nearest whole number.
Location Salary 1st Salary 2nd Salary 3rd Salary 4th Salary 5th
Year Year Year Year Year
Denver, CO $103,000
Seattle, WA $108,000
Toledo, OH $100,000
d. Suppose that the CPI index numbers you were initially given continue to hold across the five year period of time. (That is, the CPI in Denver stays at 105.677-this simplifies the problem considerably!) If Mariyana is interested solely in selecting the job with the greatest purchasing power at the fifth year, which job would be best? Explain your answer.