Assignment:
Refer to the box plot below to answer the questions.
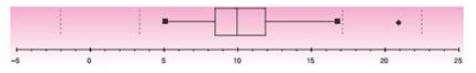
Q1. What is the interquartile range for this data set?
Q2. What can you say about the skewness of this data set?
Q3. For this data set, the value of 9.5 is more likely to be (choose one)
a. The first quartile rather than the median.
b. The median rather than the first quartile.
c. The mean rather than the mode.
d. The mode rather than the mean.
Q4. If a data point that was originally 13 is changed to 14, how would the box plot be affected?
Your answer must be typed, double-spaced, Times New Roman font (size 12), one-inch margins on all sides, APA format and also include references.