Solve the following:
Q: Consider the xbar chart for the piston-ring example as follows, let ring diameter be normally distributed, and the sample size is n = 5.
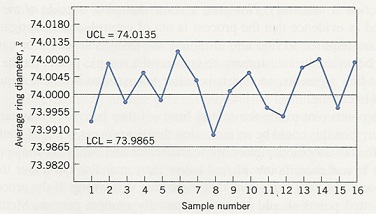
a) Find the two-sigma control limits for this chart.
b) Suppose it was suggested that the two-sigma limits be used instead of the typical three-sigma limits. What effect would this have on the occurrence of false alarms?
c) What effect would the use of two sigma limits have on the in-control ARL of the chart.
d) Discuss the meaning of your findings in parts (b) and (c).