Question 1: Which of the following represents a hardware strategy to increase signal to noise ratio?
a. Ensemble averaging
b. Fourier filter
c. Faraday cage
d. Background subtraction
Question 2: Why are atomic emission lines sharp, whereas molecular fluorescence lines are broad?
a. Because you measure atomic emission at very high temperatures and molecular fluorescence is normally measured at room temperature
b. Because atoms disperse energy by collisions with other atoms, which is more frequent than molecular collisions
c. Because molecules consist of several atoms whose fluorescence overlaps, whereas atoms emit only a single emission line.
d. Because molecules can be excited into vibrational states, whereas atoms don't undergo vibrations
Question 3: Which X-ray spectroscopy technique measures emitted valence electrons due to electronic relaxation of the sample?
a. X-ray Photoelectron Spectroscopy
b. Auger Electron Spectroscopy
c. X-ray Fluorescence Spectroscopy
d. X-ray Absorption Spectroscopy
Question 4: Raman spectroscopy uses a visible or near-IR laser source but Raman spectra are typically being plotted in the range from about 100 to 4000 cm-1, which is well within the IR range. Why?
a. Raman emission occurs in the IR light range
b. The laser light is in elastically scattered in the infrared region
c. The plotted data represents an energy shift from the excitation laser. This shift has the same energy magnitude as IR light
d. We are measuring Stokes lines, which lie at lower energy than the excitation laser and therefore in the IR region
Question 5: Which of the following processes is NOT associated with X-ray spectroscopies?
a. The emission of a core electron
b. The emission of an Auger electron
c. The emission of an X-ray photon
d. The emission of an IR photon
Question 6: H3PO4 is a triprotic acid with pKa1 = 2.1, pKa2 = 7.2 and pKa3 = 12.4. Sketch the speciation plot of this acid through all its species in the diagram below and identify the plotted graphs. Determine the dominant species at pH=10.
Question 7: You have measured light intensities of your incoming light beam with I0 = 50.000 mW and after passing 1cm of your sample solution I1 = 0.820 mW. The blank has shown an absorbance of 0.232. Calculate the concentration of your species, given an extinction coefficient at the measured wavelength of 121 M-1 cm-1. Show your calculations. Be mindful of significant figures.
Question 8: The signal to noise ratio in Raman spectroscopy is often affected by fluorescence background. Describe the origin of this background, explaining the excitation and emission processes. Give an example of how you can reduce this background.
Question 9: Describe the general composition of a FTIR spectrometer. What is the purpose of the interferometer?
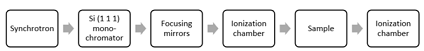
Question 10: The block diagram below describes the setup of an X-ray absorption spectrometry instrument. Describe and justify the likely purpose of the two ionization chambers.
Our X-Ray Spectroscopy Technique Assignment Help service provides the most authentic and top-notch assignment paper to secure higher grades. We are charging affordable prices all along with seasonal discounts and freebies to our regular customers. Wait no more and approach us now.
Tags: X-Ray Spectroscopy Technique Assignment Help, X-Ray Spectroscopy Technique Homework Help, X-Ray Spectroscopy Technique Coursework, X-Ray Spectroscopy Technique Solved Assignments, FTIR Spectrometer Assignment Help, FTIR Spectrometer Homework Help, Raman Spectroscopy Assignment Help, Raman Spectroscopy Homework Help