Exercise 1:
The following production plans are feasible:
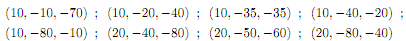
The negative numbers stand for inputs and the positive one for output.
a. In a graph with the two inputs in each axis, plot all 8 production plans.
b. Technology is convex and has constant returns to scale. Which production plans can you eliminate for being non-effi cient? Graph the isoquants for output equal to 20 and 10.
c. New technology is discovered. Now the production plan (20, 80, 30) is feasible. Eliminate non-effi cient production plans and graph the new isoquant for y = 20:
d. Show that (10,-40,-20) is not efficient either.
Exercise 2:
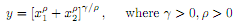
For the following production function:

a. Show whether the function exhibits constant, increasing or decreasing returns to scale for different parameter values (of α�).
b. Select three values for parameter�, one representing decreasing, one constant and one increasing returns to scale. Draw two isoquants in a graph, one for y = 1 and one for y = 2: Use the graph to show the returns to scale of the production function.
c. Define the long-run cost minimization problem for the firm.
d. Obtain the long-run input demands, total cost and average cost all as a function of output y, input prices w1,w2 and technology parameter �. Also, obtain the short-run average costs for K = 1:
e. Graph the (long-run) average cost functions for all three cases in part (b). They should have a very essential difference. Why? (your answer should point towards returns to scale).
f. For the case of decreasing returns to scale in part (b) assume that the market operates under perfect competition. Obtain Quantity produced and profits for the firm (as a function of parameters w1,w2, p). Also obtain the unconditional input demands (as a function of parameters w1,w2, p).
g. For the case of constant returns to scale in part (b) obtain the output price p (as a function of input prices w1,w2) that implies zero profits for the firm . Argue that a higher price is not consistent with perfect competition and a lower one would induce the firm to shut down.
h*. For the case of increasing returns to scale in part (b) assume that the firm has a monopoly. The inverse demand function is:
p = Ay-β
Obtain the profit-maximizing quantity and price.
OPTIONAL**: Determine the necessary restrictions on parameter values for this problem to make economic sense.
Exercise 3
For the following production function:
a. Determine the relationship between and returns to scale.
b. Obtain the long-run input demand functions and the total cost function when assuming w1 = w2:
c. Determine the relationship between and both the average and marginal cost function. Explain brieáy why this is consistent with your answer to (a).
Exercise 4
a. Prove that if a production function exhibits constant returns to scale then it can be re-expressed as:

Consider the following production function:
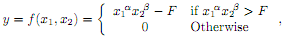
where y is output produced and F represents a quasi-fixed output cost. In other words, (y + F) can be reinterpreted as total production, but where the first F units are worthless and the rest y is useful..
b. Prove that if � α + �β �≥ 1 then the function exhibits increasing returns to scale.
c. Prove that if �α + �β� < 1 then the function will exhibit decreasing returns to scale (regardless of the scaling rate) only if the ratio of useful production to total production is greater than �α + �β�.