Solve the following problem:
Table 1
An insurance company evaluates many numerical variables about a person before deciding on an appropriate rate for automobile insurance. A representative from a local insurance agency selected a random sample of insured drivers and recorded, X, the number of claims each made in the last 3 years with the following results:
X f
1 14
2 18
3 12
4 5
5 1
1. Referring to Table 1, how many drivers are represented in the sample?
a) 5 c) 15
b) 18 d) 50
2. Referring to Table 1, how many total claims are represented in the sample?
a) 15 c) 50
b) 111 d) 250
Table 2
The following are the duration in minutes of a sample of long-distance phone calls made within the continental United States reported by one long-distance carrier
Time (minutes) Relative Frequency
0 < 5 .37
5 < 10 .22
10 < 15 .15
15 < 20 .10
20 < 25 .07
25 < 30 .07
30 or more .02
3. Referring to Table 2, what is the width of each class?
a) 1 minute c) 5 minutes
b) 2% d) 100%
4. Referring to Table 2, what is the cumulative relative frequency for the percentage of calls that lasted under 20 minutes?
a) 0.10 c) 0.59
b) 0.76 d) 0.84
Table 3
The frequency distribution below represents the rents of 250 randomly selected federally subsidized apartments in Main.
Rents ($) Frequency
300 < 400 113
400 < 500 85
500 < 600 32
600 < 700 16
700 < 800 4
5. Referring to Table 3, ----------the number of apartments rented for no less than $600
6. Referring to Table 3, the relative frequency of the second class is -----------------------
7. Referring to Table 3, the percentage of apartments renting for less than $600 is -----------------
8. In a sample of size 40, the sample mean is 15. In this case, the sum of all observations in the sample is ∑X = _______________
Table 4
Health care are receiving much attention in both academic and political arenas. A sociologist recently conducted a survey of citizens over 60 years of age ( and over) whose net worth is too high to qualify for Medicaid and have no private health insurance. The ages of 5 uninsured senior citizens were as follows:
X (X-X) (X-X)2
60 ------ ------
60 ------ ------
60 ------ ------
60 ------ ------
60 ------- ------
∑ X = ___ ∑ (X-X)= ∑ (X-X)2 =
9. a) Complete the blank spaces in Table 4
b) What is the mean?
c) Calculate the standard deviation:
S = ∑ (X-X)2
n-1
d) Is the standard deviation (σ ) zero?
i) If Yes, EXPLAIN
ii) If no, EXPLAIN
TABLE 5
Every spring semester, the School of Business coordinates with local business leaders a luncheon for graduating seniors, their families, and friends. Corporate sponsorship pays for the lunches of each of the seniors, but students have to purchase tickets to cover the cost of lunches served to guests they bring with them. The following histogram represents the attendance at the senior luncheon, where X is the number of guests each graduating senior invited to the luncheon and f is the number of graduating seniors in each category.
10. Referring to the histogram from Table 5, how many graduating seniors attended the luncheon?
a) 4 b) 152 c) 275 d) 388
11. A professor of economics at a small Texas university wanted to determine what year in school students were taking his tough economics course. Shown below is a pie chart of the results. What percentage of the class took the course prior to reaching their senior year?
a) 14% b) 44% c) 54% d) 86%
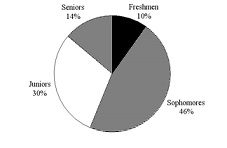
TABLE 6
The data below represent the amount of grams of carbohydrates in a serving of breakfast cereal in a sample of 11 different servings.
11 15 23 29 19 22 21 20 15 25 17
12) Referring to Table 6, the arithmetic mean carbohydrates in this sample is ________ grams.
13) Referring to Table 6, the median carbohydrate amount in the cereal is ________ grams.
14) Referring to Table 6, the first quartile of the carbohydrate amounts is ________ grams.
15) Referring to Table 6, the third quartile of the carbohydrate amounts is ________ grams.
16) Referring to Table 6, the range in the carbohydrate amounts is ________ grams.
17) Referring to Table 6, the variance of the carbohydrate amounts is ________ grams
18) Referring to Table 6, the standard deviation of the carbohydrate amounts is ________ grams.
19) Referring to Table 6, the coefficient of variation of the carbohydrate amounts is ________ percent.
20) Referring to Table 6, the five-number summary of the carbohydrate amounts consists of ________, ________, ________, ________, ________.
21) Referring to Table 3-2, construct a boxplot for the carbohydrate amounts.
22) Referring to Table 6, what type of shape does the distribution of the sample appear to have? Explain