Question: The table sets out the demand and supply schedules for chewing gum.
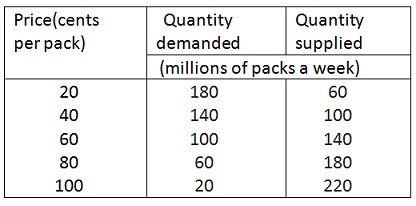
a) Draw a graph of the market for chewing gum. What are the equilibrium price and quantity? Mark the equilibrium price and quantity in the graph.
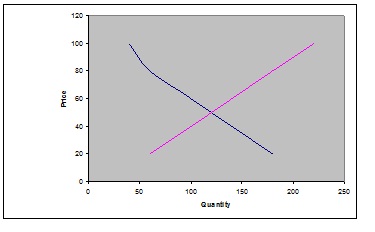
The Equilibrium price is 50 cents per pack and the quantity is 110 millions of packs a week.
Draw Graph.
(b) Suppose that the price of chewing gum is 70¢ a pack. Describe the situation in the chewing gum market (shortage or surplus and why?) and explain how the price adjusts.
If the price of chewing gum is 70¢ a pack, this means the price of the chewing gum is increased 20 cents per pack. This will decrease the quantity to 70 millions of packs a week. This occurs because in the market if the price of chewing gum will increase, the demand will become less, as it will seem to be expensive for the consumers. They might find cheap alternative to this product.
(c) Suppose that the price of chewing gum is 30¢ a pack. Describe the situation in the chewing gum market (shortage or surplus and why?) and explain how the price adjusts.
Similarly, if the price will go down to 30 cents per pack, it will increase in the demand of chewing gum. The more the demand, the more will be supplied in the market. This price will raise the demand to 140 millions of packs a week. Reducing price will increase the market share of chewing gum.
(d) Suppose a fire destroys some factories that produce chewing gum and the quantity of gum supplied decreases by 40 million packs a week at each price. Explain what happens in the market for gum and illustrate the changes on your graph.
Question:
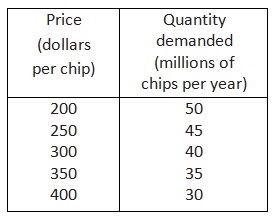
The demand schedule for computer chips is in the table.
(a) What happens to total revenue if the price falls from $400 to $350 a chip and from $350 to $300 a chip?
(b) At an average price of $350, is the demand for chips elastic, inelastic, or unit elastic? Use the total revenue test to answer this question.
(c) At $250 a chip, is the demand for chips elastic or inelastic? Use the total revenue test to answer this question.
When Alex’s income was $3,000, he bought 4 bagels and 12 donuts a month. Now his income is $5,000 and he buys 8 bagels and 6 donuts a month.
(d) Calculate Alex’s income elasticity of demand for bagels.
(e) Calculate Alex’s income elasticity of demand for donuts.
Suppose a drought cuts the quantity of wheat grown by 2 per cent.
(f) If the price elasticity of demand for wheat is 0.5, by how much will the price of wheat rise?
(g) If pasta makers estimate that this change in the price of wheat will increase the price of pasta by 25 per cent and decrease the quantity demanded of pasta by 8 per cent, what is the pasta makers’ estimate of the price elasticity of demand for pasta?
(h) If pasta sauce makers estimate that, with the change in the price of pasta, the quantity of pasta sauce demanded will decrease by 5 per cent, what is the pasta sauce makers’ estimate of the cross elasticity of demand for pasta sauce with respect to the price of pasta?
Question:
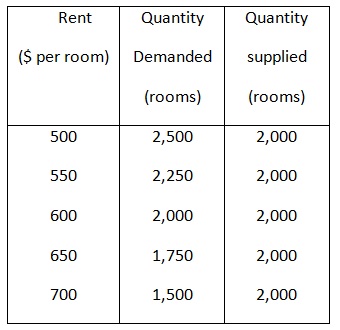
Part A: The table shows the demand and supply schedules for low-cost housing.
(a) If the government puts a rent ceiling of $650 a month on rooms, what is the rent paid, how many rooms are rented and is the low-cost housing market efficient?
(b) If the government strictly enforced a rent ceiling of $550 a month, what is the rent paid, how many rooms are rented and is the low-cost housing market efficient?
(c) Suppose that with a strictly enforced rent ceiling of $550 a month, a black market develops. How high might the black market rent be? Would the low-cost housing market be fair? Explain your answer.
Part B: Fair Work Australia has increased the minimum wage by $26 a week, lifting the minimum weekly pay to $569.90. The union movement had been pushing for a $27 a week increase, but employer groups had argued that that level of increase was unaffordable and would send smaller firms to the wall.
Source: ABC News, 11 February 2011
(d) On a graph of the market for low-skilled labor, show and explain the effect of the $26 a week increase in the minimum wage on the quantity of low-skilled labor employed. Assume that equilibrium employment was 100 thousand hours per week and the equilibrium wage rate was $544.00 per week.
(e) Explain the effects of the $26 a week increase in the minimum wage on the workers’ surplus and the firms’ surplus. Has the labor market become more efficient or less efficient? Explain and show the welfare measurement analysis in the graph.
Question:
Coal Shortage at China Plants Chinese power plants have run short of coal, an unintended effect of government-mandated price controls — a throwback to communist central planning ----- to shield the public from rising global energy costs. … Beijing has also frozen retail prices of gasoline and diesel. … Oil refiners say they are suffering heavy losses and some began cutting production last year, causing fuel shortages in parts of China’s south.
(a) Are China’s price controls described in the news clip price floors or price ceilings?
(b) Explain how China’s price controls have created shortages or surpluses in the markets for coal, petrol, and diesel.
(c) Illustrate your answer to (b) graphically by using the supply and demand model.
(d) Explain how China’s price controls have changed consumer surplus, producer surplus, total surplus, and the deadweight loss in the markets for coal, petrol, and diesel.
(e) Illustrate and show your answer to (d) graphically by using the supply and demand model.
Question:
South Korea is one of major beef importing countries. With no international trade, Korea’s equilibrium price for beef was $10 million per kilo tonne and equilibrium quantity was 30 kilo tonne. If Korea opens its market to international trade with no tariff, domestic supply would be 10 kilo tonne and domestic demand would be 50 kilo tonne at the world price of $5 million per kilo tonne. However, Korea currently imposes 40 per cent tariff rate on all imported beef. With 40 per cent tariff, Korea’s domestic supply and domestic demand are 20 kilo tonne and 40 kilo tonne respectively. Assume that intercept of supply curve is $3 million and demand curve is $15 million per kilo tonne.
(a) Draw a graph to analyze the effects of 40 per cent tariff rate in Korea on the price, domestic supply of and demand for beef, and compare the situation with no tariff case.
(b) Use the graph to illustrate and identify the gains and losses from trade with 40 per cent tariff rate, the tariff revenue and the deadweight loss.
(c) Calculate the values of change in consumer surplus, producer surplus, tariff revenue and the amount of deadweight loss.
(d) Suppose that Korea does not impose tariff any more but instead imposes an import quota of 20 kilo tonne. Draw a graph to illustrate the gains and losses from the import quota and on the graph identify the gains and losses, the importers’ profit and the deadweight loss.