Question 1. Answer the following question based on the graph below which depicts the market for bicycles in Econoland, a small closed economy. D is the demand curve, S is the supply curve, P is the price per bicycle and Q is the quantity of bicycles.
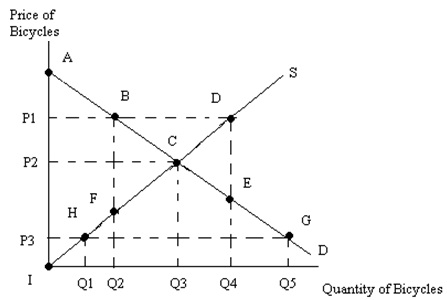
a. Suppose the government passes a price floor in the market for bicycles and this price floor is set at P1.
i. Given this price floor, consumer surplus = ______
ii. Given this price floor, producer surplus = ______
iii. Given this price floor, deadweight loss = ______
b. Suppose the world price of bicycles is P3 and Econoland simultaneously eliminates the price floor while opening up its bicycle market to trade.
i. Given this information, consumer surplus with trade = ________
ii. Relative to the closed economy (with no price floor) the open economy's area of consumer surplus (increases, decreases) by area ________
iii. When Econoland opens this market to trade, Econoland (exports, imports) an amount of bicycles equal to ________
Question 2. Consider the market for pillows in Slumberland, a closed economy. The following equations represent the domestic demand in Slumberland for pillows and the domestic supply in Slumberland for pillows where P is the price per pillow and Q is the quantity of pillows.
Domestic Demand: P = 1000 - 4Q
Domestic Supply: P = 6Q
You are also told that the world price of pillows is $200.
a. Suppose Slumberland opens its pillow market to trade. Calculate the level of imports or exports in Slumberland when it opens this market to trade.
b. Suppose Slumberland after opening this market to trade imposes a tariff so that the price of pillows after imposition of this tariff is $300.
i. If Slumberland decided to replace this tariff with a quota, how big would the quota need to be in order for the two policies to have the same deadweight loss?
ii. Suppose Slumberland has imposed the tariff. Calculate the deadweight loss from this tariff. Show your work for full credit.
Question 3. Suppose the hat market has two customers, Chris and Jon. The two graphs below provide their two demand curves for hats. In the third graph draw the market demand curve and indicate the coordinates (x, y) for the endpoints of any segments of this demand curve. Then write the equation(s) for this demand curve and indicate the range of prices for each segment of the demand curve. Use P to represent the price per hat and Q to represent the quantity of hats.