Problem 1: Suppose that the governmental authorities wished to decrease use of a pesticide that is leaching into groundwater supplies in a watershed by 60% from current use levels. Discuss the advantages and/or disadvantages of distributing marketable pesticide permits to each farm operating in the watershed equal to 40% of its current level of use of that pesticide, versus simply ordering each farm to reduce pesticide use to 40% of current levels under threat of heavy fines for non-compliance.
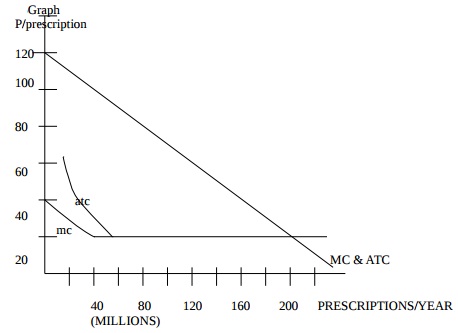
Problem 2: Assume the graph below represents the market demand for a patented prescription drug together with the long run marginal cost and average cost functions for producing the drug. (note: the diagram assumes that at output levels over 50 million AFC ~ 0, and MC is constant so that ATC = AVC =MC = $20)
A) Draw the marginal revenue function for this firm.
B) What is the profit-maximizing price for this firm?
C) On the graph show the area which represents the net loss to society resulting from the monopoly power conferred by the patent.
D) What do you predict will happen to the structure of competition and to the price in this market when the patent expires? (Hint: use the concept of "Minimum efficient scale " of production in your answer.)