Instructions: Write the final answer on your answer sheet and also attach a printout of the relevant portion. Include all intermediate steps and indicate clearly the final solution.
1. Does the stock market efficiently use information in valuing stocks? The Efficient Markets Hypothesis (“EMH”), developed by Nobel-prize winner Eugene Fama, maintains that current stock prices fully reflect all available information. An implication of this hypothesis is that returns in the current period should not be systematically related to information known in earlier periods. Otherwise, we could use this information to predict stock returns, thus violating EMH. As an analyst at an investment management company, you have been tasked with examining the validity of the EMH. You obtained a dataset of 142 randomly selected firms that listed in the New York Stock Exchange, consisting of the following four variables.
- return: Total return from holding a firm’s stock over a one-year period, from the January
- dkr: A firm’s debt to capital ratio in 2013.
- lnetincome: Natural log of the net income for a firm in 2013.
- lsalary: Natural log of the total compensation for a firm’s CEO in 2013.
Using these data, you estimated the following two regressions using Stata. 2014 to December 2014. Note that an annual return such has 31.4% is entered in the dataset as 31.4.
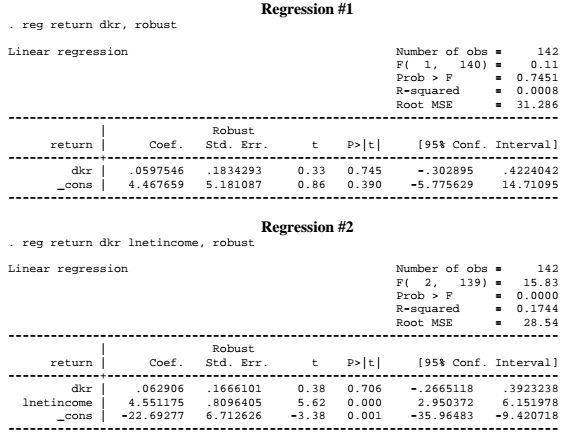
a) Based on the results for the two OLS regressions, what is the sign of the correlation between dkr and lnetincome? Alternatively, is there not enough information to determine the sign of the correlation?
b) Interpret the coefficient on lnetincome in Regression #2.
Now suppose you added another variable to the regression, and obtained the following regression results.
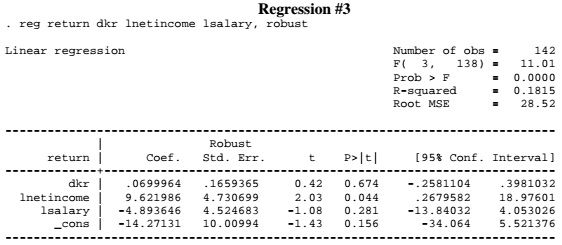
c) Suppose that you use Regression #3 to examine whether EMH holds. What are the null and alternative hypotheses?
d) Carry out the test in part (c) at the 5% level. Do you reject or fail to reject the null hypothesis?
e) Interpret the result you obtained in part (e), in light of your task of examining the validity of EMH.
f) Provide (at least) two reasons why there might be imperfect collinearity present in Regression #3.
g) Which of the following statements is true based on a comparison of Regression #2 and Regression #3? (i) dkr and lnetincome are highly correlated; (ii) dkr and lsalary are highly correlated; (iii) lnetincome and lsalary are highly correlated; (iv) All of the above; or (v) None of the above.
h) The sample of 142 stocks only include companies that were traded on the NYSE as of the end of 2013. A company that went out of business, for instance, before the end of that year could not enter the sample. How would this sampling affect the estimated coefficient relative to the population regression?
2. Antitrust authorities have long been concerned that airline carriers may exercise their market power by charging higher fares. The greatest concern arises when one airline runs the vast majority of flights in and out of an airport. Usually this happens when an airline designates an airport as a national or regional “hub” of their operations. The dataset PS4data(airfares).dta is consists of average fares and other characteristics of popular U.S. origin-destination pairs (e.g., Boston-Chicago) for the year 2000:
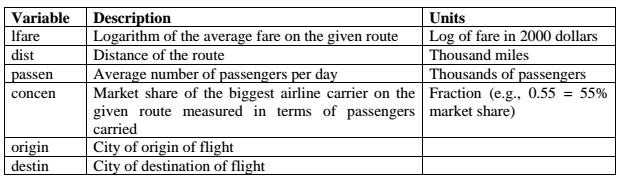
a) Regress lfare on dist, passen and concen, with appropriate standard errors.
b) What is the interpretation of the coefficient sitting on passen?
c) Based on your OLSEs, and assuming the OLS assumptions hold, what is the partial effect of the market share of the largest carrier on air fares? Is your answer consistent with the hypothesis that firms use their market power to charge higher prices?
d) How would you test whether market power is used the same way on more popular and less popular routes? Write down the model and the hypothesis, carry out the estimation and the test.
e) We need to question whether the results of the regression in part (d) is revealing a causal relationship between concentration and airfares. In particular, we are concerned whether our estimation results on U.S. data is valid for other markets, such as Europe and Asia. Give one reason why the results would not be “externally valid” if applied to the airline industry in one of these other two regions.
f) We are also aware of several potential threats to “internal validity” of the results. For each one of the five main internal validity threats, describe one possibility that could plausibly lead to the particular threat:
i) Omitted variables
ii) Errors in variables
iii) Specification error
iv) Sample selectivity
v) Simultaneous causality
3. The World Health Organization (“WHO”) collects data which assesses the health care outcomes of the populations in 191 countries across the globe, as well as exploring potential explanations for those outcomes. These data are published in the annual “World Health Report.”1PS4data(WHO).dta contains five years (1993-1997) of these data. The variables in the panel of countries include:
comp = Composite measure of health care attainment
dale = Disability adjusted life expectancy
year = 1993, . . .,1997
hexp = Per capita health expenditure
hc3 = Educational attainment (tertiary schooling)
country = Name of country
ncountry = Number assigned to country
oecd = Dummy indicator for an OECD member country
gini = Gini coefficient for income inequality
geff = World Bank measure of government effectiveness
voice = World Bank measure of democratization of the political process
tropics = Dummy indicator of tropical location
popden = Population density (people per square mile)
pubthe = Proportion of health expenditure paid by public authorities
gdpc = Normalized per capita GDP
a) For this part of the question, select data from year 1997 only. Then regress life expectancy (dale) on health expenditures (hecp) and the educational attainment in the country (hc3), and its square. Comment on whether you think the relationship between life expectancy and education is linear or quadratic and why you came to that conclusion.
b) To the specification in part (a), add the additional control variables: gini, tropics, popden, pubthe, gdpc, voice and geff. Test whether these additional regressors are jointly significant. What effect does inclusion of these additional controls have on the coefficients of the other included regressors?
c) What is the marginal effect of education on life expectancy in this expanded model? Compare to your estimated coefficients on education in (a). [Hint: use factor variables to capture the interaction effects and to be able to compute marginal effects.]
d) Return to the simpler regression specification in part (a). We want see if the determinants of life expectancy are different for rich and poor countries. Use membership in the “Organization of Economic Cooperation & Development” (oecd) as the indicator of a rich country. The OECD had 30 member countries during this time period. Perform a test of the hypothesis that all three of the coefficients in the population regression are equal for OECD and non-OECD countries. [Hint: you do not need to perform this test using factor variables.]
e) Read in the entire panel data set that includes all five years. Is this a “balanced” panel?
f) Give an example of a time-invariant variable that would result in different life expectancy across countries.
g) Estimate the regression having a fixed effect for each country in the sample. When you report your results do not include the fixed effects for all the many countries in the sample. What change took place in the coefficients on the education variables? Explain why you think there was a change in these coefficients.
h) It is likely that within each country the life expectancies are correlated from one year to the next. Estimate the fixed effects regression again, but this time compute standard errors that are clustered by country. [Hint: need to replace the “robust” option with a “cluster” option.]
i) Give an example of an entity-invariant variable that would result in variation over time in life expectancy, but which is excluded from the estimated regression model in part (a).
j) Perform regression with time fixed effects. This time include the fixed effects estimates in your answer. Are the results consistent with your reasoning about the entity-invariant variables?
k) Perform a test that all time fixed effects are jointly equal to zero.