Discuss the below:
Q1.The following scatterplot shows the miles per gallon for SUVs based on the horsepower of the engines.
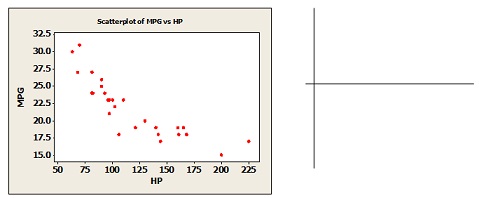
a. Draw the least squares regression line (a straight line) on the scatterplot using the eyeball approach. Use the edge of your calculator to insure that you have a straight line.
b. In the space to the right of the graph, sketch the plot of the residuals versus HP. Label the "Residuals" on the y-axis and "HP" on the x-axis. The horizontal line is at "Residual = 0.0". Do not plot all the points; just give a rough idea of what the pattern is. Using your line as the estimate of the means, determine the values of maximum positive residual and the maximum negative residual and scale the y-axis accordingly. Your values can be approximate; just get in the ballpark.
c. Based on this plot, what transformation of the Y variable would you recommend using for the next step of the analysis?