Problem 1: Develop a software "program" to plot the equations of state we have discussed in class. The program should allow you to change Tc, Pc, and accentricityfor the substance of interest and then plot a PV diagram for THREE temperaturesusing the models specified below. Your THREE temperatures should include one below Tc, one at,and one above Tc. Use your "program" to plot PV diagrams for the following materials/conditions:
(a) Propane using SRK (solid lines) and PR (dashed lines) and ideal gas (dotted line)
(a') Propane using SRK (solid lines) and truncated Virial (dashed lines) and Lee-Kesler(dotted line)
(b) n-Butane using SRK (solid lines) and (dashed lines) and ideal gas (dotted line)
(b') n-Butane using SRK (solid lines) and truncated Virial (dashed lines)
(c) Sulfur dioxide using SRK (solid lines) and PR (dashed lines) and ideal gas (dotted line)
(c') Sulfur dioxide using SRK (solid lines) and truncated Virial (dashed lines)
Find experimental data for these fluids on the NIST website. Input the data and include the experimental data on your graphs as points, rather than lines.
Each graph should include a legend. If you are planning to print out your graphs in black and white, there should be six graphs, one for each letter above. Graphs for (a) and (a') should be plotted with the same scale for each axis. If you are planning to print out your graphs in color, you may combine graphs (a) and (a') into the same graph; vary the color, but maintain the solid/dashed/dotted specifications above.
Upload your "program" to a HW7 Dropbox on ANGEL. The file name should be: "YourLastName_HW7_Problem1. Print out the graphs for submission of a hard copy.
By "program", you may use either Excel, Mathematica, or Matlab. The program (or sheet, if using Excel) should have sufficient annotation that you know where to input Tc, Pc, and accentricity and also annotation so that the required units are clear and consistent. If using Excel, you may copy each sheet so that each graph above is on a separate sheet. If using Mathematica, you need only one program.
Problem 2: Experimental data for these fluids is included in the Homework folder. Calculate the error, at a given T and V, for each method as follows:
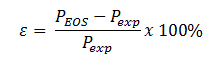
Plot the error, e, for each graph in Problem 3.1, using the same format. You may omit Lee-Kesler from this problem.
Problem 3: Discuss the applicability of each model. Does it differ based on the interactions you would expect for each model. Can you conclude that one of the models is 'better' than the others from your graphs/analysis in Problems 3.1-2? Are there any situations in Problem 3.1-2 that demonstrate the model should NOT be used for the given substance?
Problem 4: Calculate the molar volume of saturated liquid (VL) and the molar volume of saturated vapor (Vv) by the Peng Robinson equation for the following:
(a) Propane at 40 C where Psat =13.71 bar.
(b) Propane at 50 C where Psat = 17.16 bar.
(c) n-Butane at 100 C where Psat = 15.41 bar
(d) n-Butane at 110 C where Psat = 18.66 bar
(e) n-Butane at 120 C where Psat = 22.38 bar
(f) Sulfur dioxide at 80 C where Psat = 18.66 bar
(g) Sulfur dioxide at 100 C where Psat = 28.74 bar.