Assignment:
Q1. At α = 0.05 and 0.10, test the hypothesis that the proportion of Consumer (CON) industry companies winter quarter profit growth is more than 2% greater than the proportion of Banking (BKG) companies winter quarter profit growth, given that p CON=.20, p BKG=.14, nCON = 350, nBKG=400.
Q2. The mid-distance running coach, Zdravko Popovich, for the Olympic team of an eastern European country claims that his six-month training program significantly reduces the average time to complete a 1500-meter run. Five mid-distance runners were randomly selected before they were trained with coach Popovich's six-month training program and their completion time of 1500-meter run was recorded (in minutes). After six months of training under coach Popovich, the same five runners' 1500 meter run time was recorded again the results are given below.
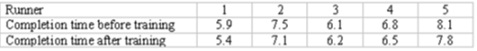
At an alpha level of .01, can we conclude that there has been a significant decrease in the mean time per mile? Show calculations too.
Q3. Test H0: μ1 ≤ μ2; H1: μ1 > μ2 at α = 0.05, when X1‾ = 75, X2‾ = 72, s1 = 3.3, s2 = 2.1, n1= 6, n2= 6. Assume equal variances. Indicate which test you are performing; show the hypotheses, the test statistic and the critical values and mention whether one-tailed or two-tailed.
Q4. Consider the 3X2 contingency table below
Factor B
Factor A B1 B2
A1 16 14
A2 15 25
A3 9 21
At a significance level of 0.10, test H0: the factors A and B are independent.
Q5. In the past, of all the students enrolled in "Basic Business Statistics" 10% earned A's 20% earned B's, 30% earned C's, 20% earned D's and the rest either failed or withdrew from the course. Dr Johnson is a new professor teaching "Basic Business Statistics" for the first time this semester. At the conclusion of the semester, in Dr. Johnson's class of 60 students, there were 10 A's, 20 B's, 20 C's, 5 D's and 5 W's or F's. Assume that Dr. Johnson's class constitutes a random sample. Dr Johnson wants to know if there is sufficient evidence to conclude that the grade distribution of his class is different than the historical grade distribution. Use α =.05 and .01 and perform a goodness of fit test.
Q6. A recent national survey of hospital admissions for people between 25 and 50 years who had hospital admissions in during a two years' period showed that 30% had 1 admission only, 25% had two admissions, 15% had 3 admissions, 12% had 4 admissions, 8 % had 5 admissions, 10% had 6 admissions or more admissions. The mayor of a small city claims that his city is much healthier than the national average. He even cites the percentages for the two extreme categories. He says that 40% of local population in the given age group have only one hospital admissions (compared to 30% national) and the percentage of 6 or more admissions is only 5% compared to national 10%. His claim was in fact based on a sample of 300 randomly selected people in the specified age group who were interviewed by a local Newspaper. It was revealed that 120 people had only 1 admission, 81 had 2 admissions, 48 had 3 admissions, 18 had 4 admissions, 18 had 5 admissions, and 15 had 6 admissions or more admissions. Does the data support the mayor's claim? Show calculations.
Q7. Use the following results obtained from a simple linear regression analysis with 12 observations.
Y^ = 27.2895-(0.91)X
R2= 0.7744 and sb1 = 0.3425
Interpret the Regression equation results including the intercept, slope and the Coefficient of Determination. Test to determine if there is a significant negative relationship between the independent and dependent variable at a = 0.05 and 0.01 (state whether it is one-tailed or two-tailed test). Also predict Y when X equals 10 units.
Q8. A local tire dealer wants to predict the number of tires sold each month. He believes that the number of tires sold is a linear function of the amount of money invested in advertising. He randomly selects 6 months of data consisting of tire sales (in hundreds of tires) and advertising expenditures (in thousands of dollars). Based on the data set with 12 observations, the simple linear regression model yielded the following results. (X is advertising expenditure in thousand dollars and Y is tires sold in hundreds): ∑X = 48; ∑Y = 84; ∑X2 = 222; ∑Y2 = 658; ∑XY = 381
Find the Intercept and slope and Write the Regression Equation. Also predict the amount of tires (in thousand tires) sold when money invested in advertising is 5 thousand dollars. Calculate the correlation coefficient and coefficient of determination. Check whether there is a relation between correlation coefficient and coefficient of determination. Calculate SSE and MSE, and standard error and t-score of the slope coefficient.