Discuss the below:
Q1)Two thousand six hundred frequent business travelers are asked which midwestern city they prefer: Indianapolis, Saint Louis, Chicago, or Milwaukee. 113 liked Indianapolis best, 455 liked Saint Louis, 1395 liked Chicago, and the remainder preferred Milwaukee. Develop a frequency table and a relative frequency table to summarize this information. (Round relative frequency to 3 decimal places.)
City Frequency Relative Frequency
Indianapolis
St. Louis
Chicago
Milwaukee
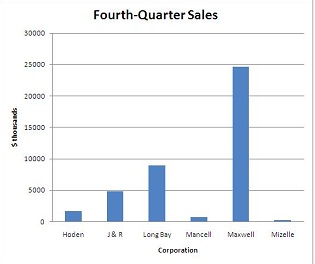
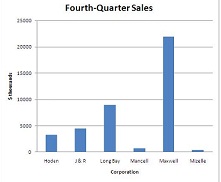
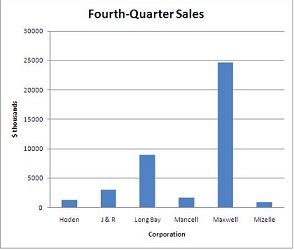
Q2) A small business consultant is investigating the performance of several companies. The fourth-quarter sales for last year (in thousands of dollars) for the selected companies were:
Company Fourth-Quarter Sales
($ thousands)
Hoden Building Products $ 1,645.2
J & R Printing Inc. 4,757.0
Long Bay Concrete Construction 8,913.0
Mancell Electric and Plumbing 627.1
Maxwell Heating and Air Conditioning 24,612.0
Mizelle Roofing & Sheet Metals 191.9
The consultant wants to include a chart in his report comparing the sales of the six companies.
Identify a bar chart that compares the fourth-quarter sales of these corporations.
Q3) The Quick Change Oil Company has a number of outlets in the metropolitan Seattle area. The daily number of oil changes at the Oak Street outlet in the past 20 days are:
65 98 55 62 79 59 51 90 72 56
70 62 66 80 94 79 63 73 71 85
The data are to be organized into a frequency distribution.
a. How many classes would you recommend?
Number of classes
d. Organize the number of oil changes into a frequency distribution. (Round relative frequency answers to 2 decimal places.)
f Relative frequency
50 up to 60
up to
up to
up to
up to
Q4) The food services division of Cedar River Amusement Park Inc. is studying the amount that families who visit the amusement park spend per day on food and drink. A sample of 40 families who visited the park yesterday revealed they spent the following amounts:
$77 $18 $63 $84 $38 $54 $50 $59 $54 $56 $36 $26 $50 $34 $44
41 58 58 53 51 62 43 52 53 63 62 62 65 61 52
60 60 45 66 83 71 63 58 61 71
a. Organize the data into a frequency distribution, using seven classes and 15 as the lower limit of the first class. What class interval did you select? (Round your answer to the nearest whole number.)
Class interval
b. Where do the data tend to cluster? (Select all that apply.)
$35 up to $45
$45 up to $55
$35 up to $45
$55 up to $65
$75 up to $85
Q5) Ecommerce.com, a large Internet retailer, is studying the lead time (elapsed time between when an order is placed and when it is filled) for a sample of recent orders. The lead times are reported in days.
Lead Time (days) Frequency
0 up to 5 6
5 up to 10 7
10 up to 15 12
15 up to 20 8
20 up to 25 7
a. How many orders were studied?
b. What is the midpoint of the first class? (Round your answer to 1 decimal place.)
c. What are the coordinates of the first class for a frequency polygon assuming we draw a frequency polygon using the midpoints? (Round your answer to 1 decimal place.)
Q6)The following cumulative frequency polygon shows the selling price ($000) of houses sold in the Billings, Montana, area.
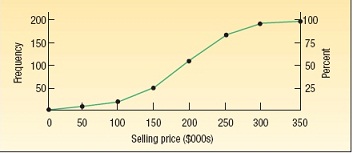
a. How many homes were studied?
b. What is the class interval?
c. One hundred homes sold for less than what amount?
d. About 75% of the homes sold for less than what amount?
e. Estimate the number of homes in the $150,000 up to $200,000 class.
f. About how many homes sold for less than $225,000?