Assignment Part A:
This part emphasizes on the use of a DSS tool, and students are required to demonstrate proficiency with Visual DSSTM (a DSS development language/DSS generator).
Solve Questions 1, 2 and 3 using VISUAL DSSTM.
Question 1:
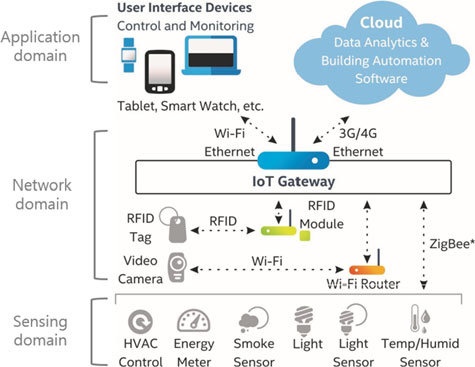
Sonoff Pty Ltd is a leading IoT (Internet of Things) company, which has wireless Wi-Fi smart home products to turn your home into a smart home at low price. In 2020, this company is planning to build a new product line to introduce LoRa WAN gateway products for future farming applications into the market in North Australia:
Under intense competitive environment, the company engaged a consulting firm to conduct a feasibility study. Senior management requires a thorough analysis of one smart gateway product that will be introduced to the market. As a senior business analyst in the consulting firm, you have been appointed to advise the senior management on the feasibility of the new product.
An initial analysis conducted by other analysts for the product claim the anticipated net present value (NPV) for the new product line is over $1 million and they have recommended the manufacture of the product based on this assessment.
Your task is to use a decision support system (DSS) and report to the senior management on whether the claim of the NPV being over $1 million is correct or incorrect using the relevant information given in Table 1.
Table 1: Summarized product details
|
Cost of production:
|
$20.00 per unit
|
|
Annual overhead cost:
|
$115,000
|
|
Initial investment needed:
|
$1,500,000
|
|
Estimated selling price:
|
$28.5 per unit
|
|
Market at time of introduction:
|
426,000 units per year
|
|
Market growth:
|
18.5% per year
|
|
Market share:
|
Most likely 21%
|
|
Assumed economically useful lifetime:
|
4 years, commencing 2020
|
|
Discount rate used to analyse new product proposals:
|
17.50%
|
You need to assume that the overhead and initial investment occurs at the START of the respective year, profit occurs at the END of the year and initial investment was only applicable to the first year.
Your task:
1. Develop a decision support model using Visual DSS using the variables described above. Include comments within your Visual DSS model to explain the variables and your calculations.
2. Based on the result of your model, what is the net present value (NPV)? Explain whether the claim regarding the NPV being above $1 million is correct or incorrect.
Hints:
- Note that overhead and initial investment both occur at the START of the respective year, and profit occurs at the END of the year.
- You should use the correct NPV formula in Visual DSS. Use the 'Help' feature within the Visual DSS application and Visual DSS tutorial to learn more about the correct NPV formula, which is applicable to the scenario, described in Question 1.
- Initial investment is a startup cost applicable to the first period only (i.e. 2020).
- The NPV is only relevant for the first period (i.e. 2020) for decision-making - so only report it for that period. Using NPV (0) in Visual DSS will allow you to achieve this.
Question 2a:
You are now asked to analyze the variations on the impact of market share, cost of producing, overheads and initial investment on the NPV.
You need to conduct a risk analysis based on the information below:
a) Unit costs can be described by normally distributed, mean of $20, standard deviation of $3.
b) Market share: triangular distribution - the range from $16% to 25% with 20% as the most likely cost.
c) Overhead: could be as low as $90,000 per year or as high as $135,000 per year but is most likely to be $125,000 per year. The distribution could be represented using a triangular distribution.
d) Market growth can be uniformly distributed between 15% and 22%.
The senior management decided on the following decision criteria:
Decision criteria: The company is unwilling to proceed if there is an60% or greater chance that the net present value will be less than $1,000,000 (1 million).
Your task:
1. You are required to use Visual DSS to run a Monte Carlo simulation (a Risk Analysis).
2. Produce a cumulative probabilities report and graph for the above question. Based on results and the decision criteria, explain whether the senior management should accept (willing) or reject (unwilling) the proposed production of the product.
Question 2b:
When the above analysis reached the Chief Executive Officer (CEO) of your company, he became very concerned about the assumptions made in the model. His experience has taught him to consider the uncertainty associated with improving selling price because of the integration of AI models in such a product. He required further analysis to be done by incorporating the following uncertainties to Question 1 model:
o Selling price: normally distributed, mean of $35, standard deviation of $4
o Unit costs: uniformly distributed between $18 and $22.
He applied different decision criteria and was willing to go ahead with the product proposal if there was at least an 80% chance the net present value would be greater than $2,000,000.
Your task:
- You are required to use Visual DSS to run a Monte Carlo simulation (a Risk Analysis). Based on your results determine whether the CEO will proceed under these uncertainties.
- Produce a cumulative probabilities report and graph for the question. Based on results and the decision criteria, will the CEO accept or reject the proposed production of the product?
Assignment Part B: (Limited to 500 words)
In this part, you are required to demonstrate data validation by using Power BI.
Power BI is a business analytics service provided by Microsoft. It provides interactive visualizations with self-service business intelligence capabilities, where end users can create reports and dashboards by themselves, without having to depend on information technology staff or database administrators.
By using Power BI Desktop, you are required to complete the following tasks:
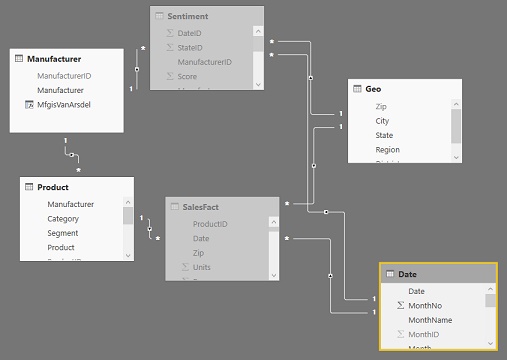
- Develop any relationship between Product, SaleFact, Date, Country and Segment for this "financial sample" as a below example of Sales and Marketing Sample:
- Generate a page dashboard to demonstrate related to sales as below:
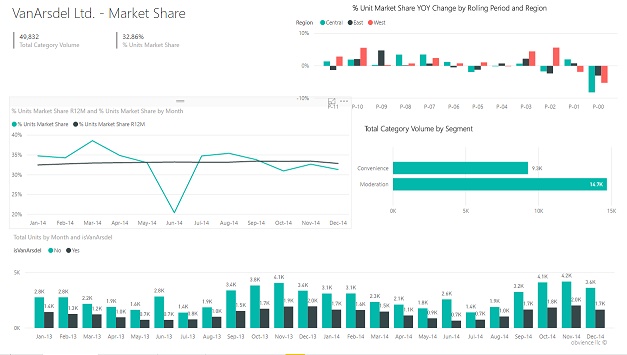
In the Page Dashboard, it should contain a title and at least the following chats:
o map
o tree map
o bar chart
- Generate a second page dashboard to show the trend or growthopportunities as above.
In the Page Dashboard, it should contain a title and at least the following charts:
o scatter chart (Sales, Product, Segment and Unit Sold)
o Line chart
o bar chart
- Use one more page dashboard tosummary the dashboards as a report:
o Discuss the trend or growth opportunities
o Indicatepotential opportunitiesand what kind of business promotion/decision making can be applied for.
Save the develop .pbix Power BI file, which contains three pages of dashboard with a developed relationship for submission.
Assignment Part C: (800-1000 words)
You are required to write a report to cover the following key points:
- In your opinion, what are the effective business models for health care startups? Justify them.
- Why or how the emerging business models can create more value by applying business intelligence as a growth engine?
- Potential Issues (such as privacy and security) and how to address them.
From a case study "Artificial Intelligence as a Growth Engine for Health Care Startups".
Are you waking up with a dream to secure maximum and outshine among your classmates? Then without wasting your valuable time, get in touch with the proficient and skilled tutors of Business Intelligence Assignment Help service.
Tags: Business Intelligence Assignment Help, Business Intelligence Homework Help, Business Intelligence Coursework, Business Intelligence Solved Assignments
Attachment:- Business Intelligence.rar