Assignment:
Many regions along the coast in North and South Carolina and Georgia have experienced rapid population growth over the last 10 years. It is expected that the growth will continue over the next 10 years. This has motivated many of the large grocery store chains to build new stores in the region. The Kelley's Super Grocery Stores Inc. chain is no exception. The director of planning for Kelley's Super Grocery Stores wants to study adding more stores in this region. He believes there are two main factors that indicate the amount families spend on groceries. The first is their income and the other is the number of people in the family. The director gathered the following sample information.
| Family |
Food |
Income |
Size |
| 1 |
|
$3.90 |
|
$73.98 |
|
2.00 |
| 2 |
|
4.08 |
|
54.90 |
|
2.00 |
| 3 |
|
5.76 |
|
142.16 |
|
4.00 |
| 4 |
|
3.48 |
|
52.02 |
|
1.00 |
| 5 |
|
4.20 |
|
65.70 |
|
2.00 |
| 6 |
|
4.80 |
|
53.64 |
|
4.00 |
| 7 |
|
4.32 |
|
79.74 |
|
3.00 |
| 8 |
|
5.04 |
|
68.58 |
|
4.00 |
| 9 |
|
6.12 |
|
165.60 |
|
5.00 |
| 10 |
|
3.24 |
|
64.80 |
|
1.00 |
| 11 |
|
4.80 |
|
138.42 |
|
3.00 |
| 12 |
|
3.24 |
|
125.82 |
|
1.00 |
| 13 |
|
5.76 |
|
77.58 |
|
7.00 |
| 14 |
|
4.48 |
|
159.28 |
|
2.00 |
| 15 |
|
6.60 |
|
30.80 |
|
2.00 |
| 16 |
|
5.40 |
|
141.30 |
|
3.00 |
| 17 |
|
6.00 |
|
36.90 |
|
5.00 |
| 18 |
|
5.40 |
|
56.88 |
|
4.00 |
| 19 |
|
3.36 |
|
71.82 |
|
1.00 |
| 20 |
|
4.68 |
|
69.48 |
|
3.00 |
| 21 |
|
4.32 |
|
54.36 |
|
2.00 |
| 22 |
|
5.52 |
|
87.66 |
|
5.00 |
| 23 |
|
4.56 |
|
38.16 |
|
3.00 |
| 24 |
|
5.40 |
|
43.74 |
|
7.00 |
| 25 |
|
7.33 |
|
45.73 |
|
5.00 |
|
Food and income are reported in thousands of dollars per year, and the variable size refers to the number of people in the household.
A. 1. Develop a correlation matrix.
2. Do you see any problems with multicollinearity?
B. 1. Determine the regression equation.
2. How much does an additional family member add to the amount spent on food?)
C. 1. What is the value of R2?
R2
2. State the decision rule for 0.05 significance level. H0: = ß1 = ß2 = 0; H1: Not all ßi's = 0.
3. Complete the ANOVA (Leave no cells blank - be certain to enter "0" wherever required. Round SS, MS, P to 3 decimal places and F to 2 decimal places.)
4. Can we conclude that this value is greater than 0?
D. 1. Complete the given below table. (Leave no cells blank - be certain to enter "0" wherever required. Round Coef, SE Coef, P to 3 decimal places and T to 2 decimal places.)
2. Would you consider deleting either of the independent variables?
E. State true or false.
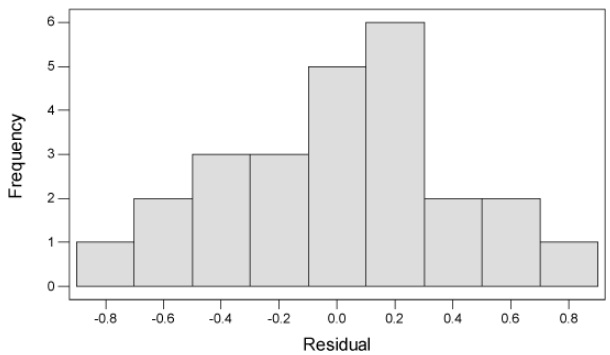
From the graph the residuals appear normally distributed.
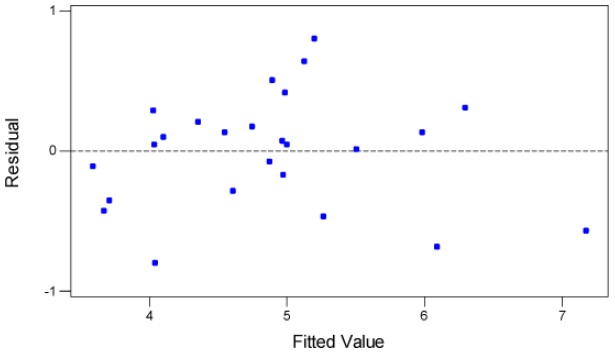
F. Choose the right option from the following graph.
Referencese Book & Resources Worksheet Learning Objective: Use multiple regression analysis to describe and interpret a relationship between several independent variables and a dependent variable. Learning Objective: Evaluate the assumptions of multiple regression. Difficulty: 2 Intermediate Learning Objective: Evaluate how well a multiple regression equation fits the data.