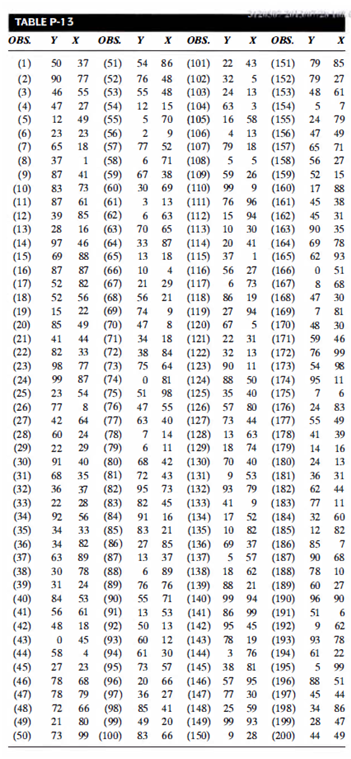
Problem 1. Consider the population of 200 weekly observations presented in Table P-13.The independent variable X is the average weekly temperature of Spokane, Washington.The dependent variable Y is the number of shares of Sunshine MiningStock traded on the Spokane exchange in a week. Randomly select data for 16 weeks and compute the coefficient of correlation.(Hint: Make sure your sample is randomly drawn from the population.) Then determine the least squares line and forecast Y for an average weekly temperature of 63.
Problem 2. An investor with a substantial stock portfolio sued her broker and brokerage firm because lack of diversification in her portfolio led to poor performance. The rates of return for the 39 months that the account was managed by the broker produced these summary statistics:X = -1.10%, S = 5.99%. Consider the 39 monthly returns as a random sample from the population of returns the brokerage would generate if it managed the account forever. Using the sample results, construct a 95% confidence interval for the mean monthly market return. Let the S&P 500 represent the market and suppose the mean S&P 500 return for the same period is 0.94%. Is this a realistic value for the population mean of the client's account? Explain.