I. Binary Choice
Problem 1. Real GDP increases in Country A from 2015 to 2016. From this information you can conclude that:
a. Nominal GDP increased from 2015 to 2016.
b. That this economy produced more goods and services in 2016 than it did in 2015.
Problem 2. The CPI rose from 120 in 2015 to 150 in 2016. Joe's nominal income increased from $40,000 in 2015 to $45,000 in 2016. From this information you can conclu de that:
a. Joe's real income increased from 2015 to 2016.
b. Joe's real income decreased from 2015 to 2016.
Problem 3. Initially a country has balanced trade and then it decides to run a trade surplus. Holding everything else constant, t his will lead this country's supply of loanable funds curve to shift to the:
a. left.
b. right.
Problem 4. Suppose an economy increases its use of labor while maintaining the same level of technology and capital. Holding everything else constant we can conclude that:
a. Labor productivi ty increases while capital productivity decreases.
b. Labor productivity decreases while capital productivity increases
Problem 5. In the Keynesian model, if government spending decreases and everything else is held constant, then the equilibrium level of real GDP will:
a. Increase.
b. Decrease.
Problem 6. If there is inadequate spending in the economy and policymakers want to restore the economy to full employment than policymakers could:
a. Increase the level of government spending holding everything else constant.
b. Decrease the level of government spending holding everything else constant.
Problem 7. Suppose there is too much spending in an economy relative to the current level of production in the economy. Based upon the Keynesian Model this sug gests that aggregate output will:
a. Increase in response to this spending.
b. Decrease in response to this spending
Problem 8. The consumption function for an economy is given as C = 100 + .75[Y – (T – TR)]. Given this informatio n and using the simple Keynesian Model presented in class, the tax expenditure multiplier is equal to:
a. - 3
b. - 4
Problem 9. Capital productivity is:
a. The change in real GDP divided by the change in the number of units of capital.
b. Real GDP divided by the number of units of capital.
Problem 10. An economic recession is:
a. A situation where the short run level of aggregate expenditure is less than the short run level of production for an economy.
b. A situation where the unemployment rate is greater than the full employment unemployment rate.
I. Multiple Choice:
Use the following Keynesian Model of a closed economy to answer the next two (2) questions.
C is consumer spending, Sp is private saving, NT is net taxes, I is investment spending, G is government spending, "a" is autonomous spending, and "b" is the marginal propensity to consume. The following variables are assumed to be constant in this problem: "a", "b", I, G and NT.
• Y = C + S p + NT
• AE = C + I + G
• C = a + b(Y - NT)
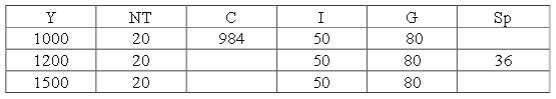
Problem 11 . Given the above information, which of the following statements is true?
I. C = 200 + .8(Y – N T)
II. When Y = 3000, S p = 396 holding everything else constant.
III. The equilibrium level of output for this economy is 1500.
a. Statement I is true.
b. Statement II is true. c. Statement I, II and III are all true statements. d. Statements I and II are true statements.
Problem 12 . Which of the following statements is true for the economy described in the above table?
a. When real GDP is equal to 1000 then inventories are increasing.
b. When real GDP is equal to 1200 then inventories are decreasing.
c. When real GDP is equal to 1500 then inventories are stable.
d. When real GDP is greater than 1600 then aggregate expenditure is greater than aggregate production.
Problem 13. Consider the loanable funds market discussed in class. In recent years Greece has been forced to reduce it s deficit spending so that their national debt would decrease. The loanable funds model suggests that this will:
a. Lead to higher interest rates as well as higher levels of investment in Greece relative to their initial levels.
b. Lead to lower interest rates a nd higher levels of investment in Greece relative to their initial levels.
c. Cause the supply of loanable funds curve for Greece to shift to the left relative to the initial situation.
d. Cause the demand for loanable funds curve for Greece to s hift to the right relative to the initial situation.
Problem 14 . Real GDP per person in Xerbia is $20,000 in 2010. Real GDP per person in Perturbia is $12,000 in 2010. Both Xerbia and Perturbia have constant populations that do not change over time. Suppose the Xerbia's real GDP per person grows at 2.5% a year while Perturbia's real GDP per person grows at 5% a year. Using the rule of 70, which of the following statements is true?
I. In 2038 real GDP per person in Xerbia will be higher than real GDP per person i n Perturbia.
II. By 2024 Perturbia's real GDP per person will be greater than Xerbia's real GDP per person.
III. By 2066 Perturbia's real GDP per person will exceed Xerbia' real GDP per person by approximately $112 ,000.
a. Statement I is true.
b. Statement II is true.
c. Statement III is true.
d. Statements I and III are true
Problem 15. In recent years many government officials around the developed world have advocated austerity policies for their economies. These officials argue that in these tough economic times belt - tightening by government, that is, a reduction in deficit spending is essential. According to the Keynesian model you studied in class this summer:
a. These austerity policies will shrink the level of equilibrium real GDP in the economy .
b. These austerity policies wil l reduce the short - run unemployment rate in the economy.
c. These austerity policies will insure that the economy returns to full employment and a lower unemployment rate in the short run.
d. These austerity polici es will cause the planned aggregate expenditure line to shift upwards.
Problem 16 . An economy has a typical aggregate production function. You are told that this economy maintains the same level of labor usage while the amount of capital used in the economy has increased. You are presenting this information to a group and you want to display the effect of this change on capital productivity. Which of the following graphs is the appropriate one to use for your presentation?
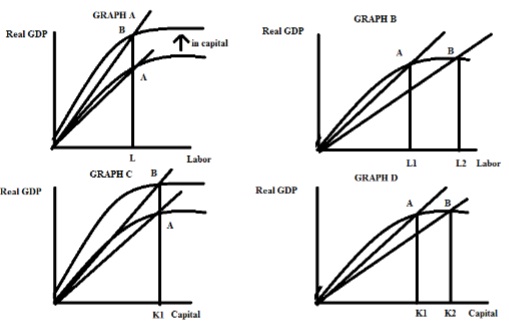
a. Graph A
b. Graph B
c. Graph C
d. Graph D
Problem 17. Holding everything else constant, the demand for loanable funds curve will:
a. Shift to the right if the government runs a surplus.
b. Shift to the left if interest rates increase.
c. Shift to the right when the country runs a trade deficit.
d. Shift to the left if there is a loss of business confidence.
Problem 18 . Consider the Keynesian model. Holding everything else constant, if autonomous taxes are increased this will:
a. Shift the planned aggregate expenditure line upwards.
b. Cause t he equilibrium level of real GDP to increase.
c. Contract the economy.
d. Reduce the level of unemployment in the economy.
Problem 19. Which of the following will not shift the supply of loanable funds curve?
a. People's tastes and preferences for savings changes due to anticipation of the need for each individual to fund their own retirement.
b. People's life expectancy decreases.
c. Capital inflows decrease.
d. The government implements a program encouraging investment in solar technology
Use the following information and the loanable funds model to answer the next three (3) questions:
G = Government Spending = $100
T – TR = Taxes – Transfers = $150
X = $30
M = $40
I = 500 – 25 r where I is investment spending and r is the interest rate recorded in the equation as a the percentage (so, for example if the interest rate is 5%, then r would be 5 in the equation) Sp = private saving = 40r – 80
Problem 20. Examine the above data. Which of the f ollowing statements is true?
I. This economy is running a trade deficit and therefore has positive capital inflows.
II. This government has positive government savings and a negative budget balance.
III. This government has a positive budget balance and can therefore be a lender of funds rather than a borrower of funds.
a. Statement I is a true statement.
b. Statement II is a true statement.
c. Statements I and II are both true statements.
d. Statements I and III are both true statements.
Problem 21. When this economy is in equilibrium, the equilibrium interest rate is ____ and the equilibrium level of total savings (private savings, government savings, and foreign savings) is ______.
a. 10%; $24 0
b. 8 %; $300
c. 10%; $300
d. 8%; $240
Problem 22 . Suppose that the government in this economy decreases its level of government spending. Holding everything else constant, you predict that:
a. Interest rates will fall; consumption spending will increase; and investment spending will decrease.
b. Interest rates will fall; consumption spe nding will increase ; and private saving will decrease.
c. Interest rates will rise; consumption spending will decrease; and private saving will increase.
d. Interest rates will rise; consumption spending will decrease; and investment spending will increase.
Problem 23. Which of the following statements is true?
I. In the Keynesian Model it is possible for the economy to be in equilibrium but to be producing at a level of output that is not the full employment level of output.
II. In the Loanable Funds Model it is possible to model a recession.
III. In the Keynesian model if the equilibrium output is less than the full employment output then the unemployment rate is relatively low.
a. Statement I is a true statement.
b. Statement II is a true statement.
c. Statements I and II are both true statements.
d. Statements I and III are both true statements.
Problem 24. Suppose a country has an aggregate production function with the typical shape discussed in class. Suppose that technology increases at the same time as the level of capital increases in the economy. Then, holding everything else constant, relative to their initial values
a. Labor productivity will increase and capital productivity will increase.
b. Labor productivity will be indeterminate and capital productivity will increase.
c. Labor productivity will increase and capital productivity will be indeterminate.
d. Labor productivity will increase and capital productivity will decrease.
Problem 25 . You are provided the following information:
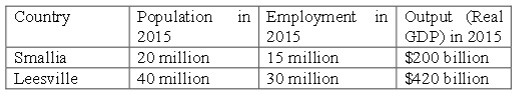
From this data you conclude that:
a. Smallia has higher GDP per capita and Leesville has high er labor productivity.
b. Smallia has higher GDP per capita and Leesville has lower labor productivity.
c. Leesville has higher GDP per capita and Smallia has lower labor productivity.
d. Leesville has higher GDP per capita and Smallia has higher labor productivity.
Problem 26. Use the information below to answer the next question.
The production function for Realland is described by the following information:
Capital Supply is constant and equal to 100 units of capital Aggregate Production Function:
Y = 20K1/2 L1/2 where Y is real GDP, K is the number of units of capital and L is the number of units of labor L = 64 units of labor Suppose that the labor supply increases to 81 units. Then, holding everything else equal, relative to the initial situation:
a. Capital productivity increases by 2 units of capital per unit of output and labor productivity decreases.
b. Capital productivity is indeterminate and labor productivity increases.
c. Capital productivity increases by 2 units of output per unit of capital and la bor productivity decreases.
d. Labor productivity decreases by approximately 3 units of labor per unit of output and capital productivity increases.
Use the information below to answer the next two questions.
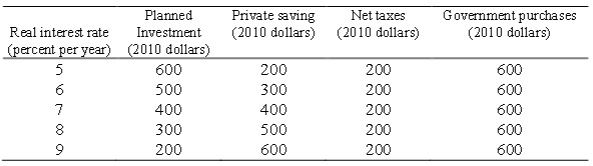
Problem 27. Suppose we meas ure the demand for loanable funds as strictly the demand for loanable funds by private businesses. Then, holding everything else constant, when the real interest rate is 8 percent, then the
a. Total quantity of funds supplied is equal to $1 00 and the budg et deficit is $400.
b. Total quantity of funds supplied is equal to $9 00 and the budget deficit is $4 00.
c. T ota l quantity of funds supplied is equal to - $1 00 and government saving is $200.
d. Total quantity of funds supplied is equal to $13 00 and governme nt saving is $400 .
Problem 28 . Given the above information and holding everything else constant, t he equilibrium interest rate is
a. 6 % .
b. 7 %.
c. 8 %.
d. 9 %.
Use the information below about a closed economy and the simple Keynesian Model d iscussed in class to answer the next two (2) questions.
C = 10 + .75[Y – ( T – TR)]
G = $50 T – TR = $40 I = $20
Problem 29. Suppose you are told that for every $100 worth of output that three people are employed. When the above economy is in equilibrium, how many people are employed?
a. 3 people
b. 3.5 people
c. 6 people
d. 9 people
Problem 30. Suppose that the government increases its spending by $20 while at the same time it also increases net taxes by $12. What is the change in real GDP due to these two changes and ho lding everything else constant?
a. $244
b. $8
c. $44
d. $116
III. Problems
1. Use the following information about an economy to ans wer this question.
C = 20 + .5(Y – T)
I = $ 100
G = $ 200
T = $ 16 0
X – IM = $ 0
Aggregate Expenditure: AE = C + I + G + (X – IM)
a. Examine the given information. What is the level of government saving in this economy? Show how you found this answer.
b. Examine the given information. Write an equation for aggregate expenditure as a function of Y . Show your work
c. Given the above information and your work, find the short run equilibrium in this economy. Show your work.
d. Suppose that Yfe is equal to 300 for this economy. Suppose the government engages in fiscal policy in the form of a change in government spending in order to reach Yfe. First, should the government increase or decrea se government spending from its i nitial level to reach this goal? And, holding everything else constant, what will the change in government spending need to be in order to reach this goal?
e. Suppose that Yfe is equal to 300 for this economy. Suppose the government engages in fiscal policy in the form of a change in net taxes in order to reach Yfe. First, should the government increase or decrease net taxes from their initial level to reach this goal? And, holding everything else cons tant, what will the change in net taxes need to be in order to reach this goal?
2. Use the loanable funds framework to answer this set of questions.
a. The graph below depicts the market for loanable funds, but regrettably it is not well labeled. So, label the axes, the lines as Slf and Dlf where Slf is the supply of loanable funds and Dlf is the demand for loanable funds, the point of equilibrium (LFe, re) where LFe is the equilibrium amount of loanable funds and re is the equilibrium interest rate
b. Suppose that in (a) the Dlf only represents the demand for loanable funds from investment spending and that the Slf only represents the supply of private savings. Suppose that now the government r uns a surplus. Illustrate the impact of this surplus on the loanable funds market b y drawing a new graph in the space below that represents the initial situation in (a) as well as the impact of this government surplus. Label any shift(s) in your graph cle arly and completely; label the new points of equilibrium (LFe', re'). Also, in your graph indicate what the level of investment spending is initially (I) and what the new level of investment spending is after the government surplus (I'). In your graph also indicate what the level of private saving is initially (Sp) and what the new level of private saving is after the government surplus (Sp').
c. Suppose that in (a) the Dlf only represents the demand for loanable funds from inve stment spending and that the Slf only represents the supply of private savings. Suppose that now the economy runs a trade surplus. Illustrate the impact of this trade surplus on the loanable funds market b y drawing a new graph in the space below that repr esents the initial situation in (a) as well as the impact of this trade surplus. Label any shift(s) in your graph clearly and completely; label the new points of equilibrium (LFe', re'). Also, in your graph indicate what the level of investment spending is initially (I) and what the new level of investment spending is after the trade surplus (I'). In your graph also indicate what the level of private saving is initially (Sp) and what the new level of private saving is after the trade surplus (Sp')