Problem 1. Darcie buys two goods: happy-face magnets and cheeseburgers. The price of a magnet is $1, and the price of a cheeseburgers is $2. Each month, Darcie spends all of her income and buys 30 magnets and 5 cheeseburgers. Next month, the price of magnet will fall to $0.50 and the price of a cheeseburger will rise to $5.
a) Will Darcie be able to buy 30 magnets and 5 cheeseburgers next month?
b) Will Darcie want to buy 30 magnets and 5 cheeseburgers at these new prices?
c) When the prices change next month, will there be an income effect and a substitution effect at work or just one of them?
d) If at the original prices, Darcie ’s marginal utility of another magnet is 40, and the marginal utility of another cheeseburger is 80, is she maximizing her utility? If not, how can she adjust her bundle so that she does maximize her utility?
Problem 2. Kim is your typical economics graduate student and consumes 2 goods: economics textbooks and coffee. Kim also earns a typical grad student income, $40 a month. He can either spend it all on books and get 5, or he can spend it all on coffee and get 20 cups.
a) Given this information, construct the equation for Kim’s budget line (put books on the x-axis and coffee on the y-axis).
b) The following are the bundles that Kim can afford with his income:
Books Coffee
1
0
8
2
Fill in the blanks in the table with the quantities that will exhaust Kim’s income.
c) Kim gets a research grant and his income increases to $80 a month. What is the new equation of his budget line? What if income stays constant at $40, and the price of a book increases to $10?
d) Assume that prices are the same as used in part a. If the marginal utility of a book is 20, what is the marginal utility of coffee if he is maximizing his utility?
e) Now assume that textbooks and coffee are complements for Kim. For him to consume one textbook, he needs 1 cup of coffee. How many textbooks does he consume given his income of $40, and the prices used in part a? What if economics is so boring that Kim needs 2 coffees for every book that he consumes?
Multiple choice Questions:
Problem 3. At prices of $6 for a CD and $4 for a cigar, Mike can afford to buy 6 CDs and 8 cigars with income I. If Mike is maximizing his utility at this bundle, what is his income?
a) I = 54
b) I = 72
c) I = 68
d) I = 100
e) I = 40
Problem 4. Christina consumes hot pants and blue eyeshadow. At prices of $2 for a pair of hot pants and $2 for blue eyeshadow, her marginal utility of consuming another unit of blueeyeshadow is 4, and her marginal utility of another pair of hot pants is 2. Which of the following statements is true (hint: picture hot pants on the y-axis and blue eyeshadow on the x-axis):
a) Christina could be on a higher indifference curve if she purchased more eyeshadow and less hot pants.
b) Christina could be on a higher indifference curve if she purchased more hot pants and lesseyeshadow.
c) Christina has purchased her optimal bundle.
d) Christina could be on a higher indifference curve if she bought less of both.
e) None of the above.
Problem 5. Laura consumes 5 pies and 7 burritos. At this bundle, Laura’s marginal utility of consuming one more pie is 10, while her marginal utility of consuming one more burrito is 5. Which of the following statements is true:
a) If Laura consumes 6 pies and 6 burritos, she will be on a lower indifference curve.
b) If Laura consumes 6 pies and 8 burritos, she will be on the same indifference curve.
c) If Laura consumes 6 pies and 8 burritos, she will be on a lower indifference curve.
d) If Laura consumes 4 pies and 8 burritos, she will be on a lower indifference curve.
e) If Laura consumes 4 pies and 8 burritos, she will be on the same indifference curve.
Problem 6. The following figure is Harvey’s budget line for broccoli and hummus:
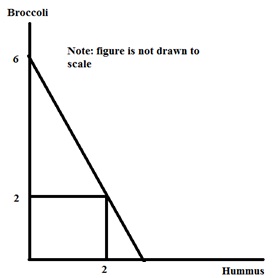
Which of the following statements is consistent with the above graph?
a) The price of hummus is $4 and the price of broccoli is $4.
b) The price of hummus is $4 and the price of broccoli is $8.
c) The price of hummus is $8 and the price of broccoli is $4.
d) The price of hummus is $4 and the price of broccoli is $6.
e) The price of hummus is $6 and the price of broccoli is $4.
Problem 7. By knowing what bundle maximizes an individual’s utility under various price levels, we can
derive a demand curve for that person. Consider the following setup:
Situation 1: Income = $20, Px = $5, Py = $2
Situation 2: Income = $20, Px = $2, Py = $2
a) Draw the budget lines for both situations on one graph, labeling them BL1 and BL2.
b) Suppose we are told something about the consumer’s preferences: in situation 1 she buys X=2 and Y=5, and in situation 2 she buys X=4 and Y=6. Mark and label these points on the appropriate budget lines, and sketch the indifference curve that the consumer reaches in each of the two situations.
c) Set up a new graph, with “Price of X” on the vertical axis and “Quantity of X” on the horizontal axis. For each of the two prices of X that we have considered, plot the price against the quantity demanded at that price (which you can see on the previous graph). Finally, sketch a line through the points and label it “Demand for X.” (Assume that the demand curve for X is a straight line.)
d) For extra practice, try assuming that the price of Y changes instead of the price of X. Suppose the new situation has price levels Px = $5 and Py = $5 (this is our “situation 3”). In this case, the individual consumes X=1 and Y=3. Using this information, along with the information provided for situation 1, derive the demand curve for Y. (Assume that the demand curve for Y is a straight line.)
Problem 8. An Indifference Curve is a line that shows all the consumption bundles that yield the same amount of total utility for an individual.
a) Suppose Jack has an income of $12 to buy two goods: sandwiches and sodas. The price of a bottle of soda is $1, and the price of a sandwich is $2. Draw Jack’s budget line (BL1) given his income is $12. (Measure sodas on the X-axis and sandwiches on the Y-axis.) Assume Jack’s utility function is U(x,y)=xy (x is the consumption amount of sodas and y is the consumption amount of sandwiches). Jack’s marginal utility of consuming sodas and sandwiches at consumption bundle (x, y) are denoted by Mux for good X andMUy for good Y respectively. Jack’s preferences are depicted by typical ICs. The consumption bundle (x, y) which maximizes Jack’s utility satisfies:
MUx/MUy=y/x.
(1) Please find the numerical values of x and y of the utility maximization point (x, y). Draw a typical indifference curve (IC1) through this utility maximization point.
(2) Suppose the price of a bottle of soda increases from $1 to $4, draw Jack’s new budget lines (BL2) and find his new utility maximization consumption bundles.
(3) Draw an imaginary budget line (BL3) parallel to the new budget line (BL2) and make it tangent to the initial indifference curve (IC1). Show the income and substitution effect of the decrease in the consumption of soda as the price of soda increases. At the new price level, at least how much income shouldJack get to achieve the original utility level? (Hint: find the tangent point of BL3 and initial indifference curve (IC1))
b) Lisa loves drinking coffee and tea. Drinking one cup of tea gives Lisa 10 utils, and drinking one cups of coffee gives her the same utility. Suppose Lisa has an income of $12 to buy coffee and tea. The price of a cup of tea is $1, and the price of a cup of coffee is $2. Draw Lisa’s budget line (BL1) given her income is $12. (Measure tea on the X-axis and coffee on the Y-axis.) Assume that the utility
from consumption of an additional unit of either good is constant (this is just a simplifying assumption to make the math easier).
(1) Please find the utility maximization point and draw an indifference curve (IC1) through the utility maximization point. (Hint: in this example, coffee and tea are perfect substitutes.)
(2) Suppose the price of a cup of tea increases from $1 to $4, draw Lisa’s new budget lines (BL2) and find her new utility maximization consumption bundles.
(3) Draw an imaginary budget line (BL3) parallel to the new budget line (BL2) and make it cross the initial indifference curve (IC1) at the lowest income level. Show the income and substitution effect of the decrease in the consumption of tea as the price of tea increases.
c) Mary is a student in the Math department who has a lot of math homework. In doing the math homework she will use pencils (assume these pencils have no erasers on their ends) to make all her calculations and an eraser to correct her answers. Mary knows that for every 2 pencils, 1 eraser will be needed. Any more pencils will serve no purpose, because she will not be able to erase the calculations. The price of an eraser is $2, and the price of a pencil is $1. Draw Mary’s budget line (BL1) given her income is $12. (Measure pencils on the X-axis and erasers on the Y-axis.)
(1) Please find the utility maximization point and draw an indifference curve (IC1) through the utility maximization point. (Hint: in this example, pencils and erasers are perfectly complements).
(2) Suppose the price of a pencil increases from $1 to $2, draw Mary’s new budget lines (BL2) and find her new utility maximization consumption bundles.
(3) Draw an imaginary budget line (BL3) parallel to the new budget line (BL2) and make it cross to the initial indifference curve (IC1) at the lowest income level. Show the income and substitution effect of the decrease in the consumption of pencils as the price of pencils increase.