Discuss the below:
Confidence interval for the ratio of population variances
Q: Actuaries use various parameters when evaluating the cost of a life insurance policy. The variance of the life spans of a population is one of the parameters used for the evaluation. Each year, the actuaries at a particular insurance company randomly sample 25 people who died during the year (with the samples chosen independently from year to year) to see whether the variance of life spans has changed. The life span data from this year and from last year are summarized below:
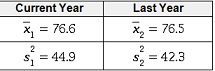
(The first row gives the sample means, and the second row gives the sample variances.)
Assuming that life spans are approximately normally distributed for each of the populations of people who died this year and people who died last year, construct a 90%confidence interval for σ12/σ22, the ratio of the variance of the life span for the current year to the variance of the life span for last year. Then complete the table below.
Carry your intermediate computations to at least three decimal places. Write your final responses to at least two decimal places.
1. What is the lower limit of the 90% confidence interval?
2. What is the upper limit of the 90% confidence interval?