Question 1) The following table is taken from the Bureau of Economic Analysis data release on quarterly GDP from 1/30/2008.
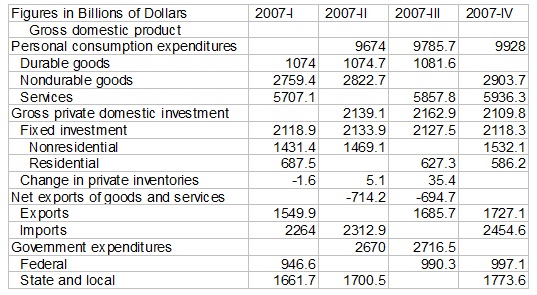
a) Fill in all the blanks in the table. (While this can be done by hand, you will find it easier to use Excel). Don’t forget to calculate GDP.
b) In their release, the BEA points out that their GDP data is “seasonally adjusted at annual rates”. Why is it important to seasonally adjust quarterly data? What patterns might emerge in US quarterly GDP data if it is not seasonally adjusted?
Question 2) Consider the following table of data for an economy.
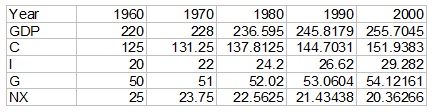
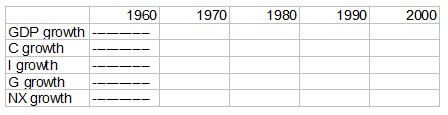
a) Using Excel, calculate the growth rates of GDP, C, I, G, and NX and present them in a table such as the one below. Put the growth rates in percentage terms.
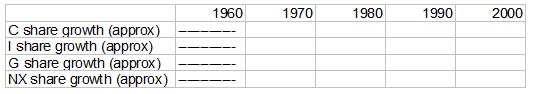
b) Now that we have the growth rates for all variables, approximate the growth rates for the share of each variable in GDP (C/Y, I/Y, G/Y, and NX/Y) using the technique discussed in class and in Mankiw. Present your answers in a table as below.
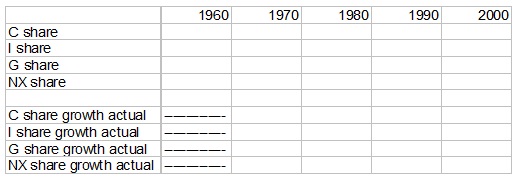
c) To check the accuracy of these approximations, compute the actual share of each variable in GDP and find the actual growth rates. Present your answers in a table as below. Put the growth rates in percentage terms.
d) How do the approximations compare to the actual growth rates? Are the approximations consistently higher or lower than the actual rates? Does this depend on the variable in question? Why might this be?
Question 3) An economy has a Cobb-Douglas production function given by Y = AK0.6L0.4, where A is the technology level, K is the capital stock, L is the size of the labor force, and Y is GDP. Use this equation to answer the questions below.
a) Assume that A is fixed at 4 and K is fixed at 10. Make a table where L ranges from 1 to 10 and compute GDP for each of these values of L. Your table should have each variable as a column, as illustrated below:
A K L GDP (A=4, K=10)
4 10 1
4 10 2
b) Using Excel, make a line graph with GDP on the vertical axis and L on the horizontal. Use the data in the table from a).
c) Now assume that the technology level increases, so A = 6, but K remains fixed at 10. Recalculate GDP as labor ranges from 1 to 10, and report your results in a table similar to the one above. You should change your GDP variable name to “GDP (A=6, K=10)”.
d) Now keep A=4, but assume that the capital stock increases, so K = 15. Recalculate GDP as labor ranges from 1 to 10, and report your results in a table similar to the one above. You should change your GDP variable name to “GDP (A=4, K=15)”.
e) Graph all three GDP calculations [(A=4, K=10), (A=6, K=10), and (A=4, K=15)] on the same graph with GDP on the vertical axis and labor on the horizontal. Make sure your graph has labels so that it is clear which line corresponds to each measure of GDP.
f) When we changed the value of A and K, we increased each by 50%. However, as our tables and graphs show, GDP increased more when we increased A by 50% than when we increased K by 50%. Looking at the Cobb-Douglas production function, why is this true? You may give either an intuitive or mathematical answer.