Discuss the below:
1 The following is a set of data from a sample of n = 5: 7 4 9 8 2
a. Compute the mean, median, and mode.
b. Compute the range, variance, standard deviation, and coefficient of variation.
c. Compute the Z scores. Are there any outliers?
d. Describe the shape of the data set.
2 The data in the file contain the total fat, in grams per serving, for a sample of 20 chicken sandwiches from fast-food chains. The data are as follows:
7 8 4 5 16 20 20 24 19 30 23 30 25 19 29 29 30 30 40 56
a. Compute the mean, median, and mode.
b. Compute the variance, standard deviation, range, coefficient of variation, and Z scores. Are there any outliers? Explain.
c. Are the data skewed? If so, how?
d. Based on the results of (a) through (c), what conclusions can you reach concerning the total fat of chicken sandwiches?
3 A bank branch located in a commercial district of a city has developed an improved process for serving customers during the noon-to-1:00 p.m. lunch period. The waiting time, in minutes (defined as the time the customer enters the line to when he or she reaches the teller window), of a sample of 15 customers during this hour is recorded over a period of one week. The results are contained in the data file Bank1 and are listed below:
4.21 5.55 3.02 5.13 4.77 2.34 3.54 3.20 4.50
6.10 0.38 5.12 6.46 6.19 3.79
a. Compute the mean and median.
b. Compute the variance, standard deviation, range, coefficient of variation, and Z scores. Are there any outliers? Explain.
c. Are the data skewed? If so, how?
d. As a customer walks into the branch office during the lunch hour, she asks the branch manager how long she can expect to wait. The branch manager replies, "Almost certainly less than five minutes." On the basis of the results of (a) through (c), evaluate the accuracy of this statement.
4 The data file Chicken contains the total fat, in grams per serving, for a sample of 20 chicken sandwiches from fast-food chains. The data are as follows: (see Chicken tab)
7 8 4 5 16 20 20 24 19 30
23 30 25 19 29 29 30 30 40 56
a. Compute the first quartile (Q1), the third quartile (Q3), and the interquartile range.
b. List the five-number summary.
c. Construct a boxplot and describe the shape. (Do not do C)
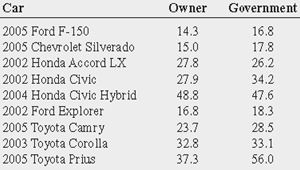
5 There are several methods for calculating fuel economy. The following table (contained in the file Mileage) indicates the mileage, as calculated by owners and by current government standards: (see Mileage tab)
a. Compute the covariance.
b. Compute the coefficient of correlation.
c. Which do you think is more valuable in expressing the relationship between owner and current government standards mileage-the covariance or the coefficient of correlation? Explain.
d. What conclusions can you reach about the relationship between owner and current government standards mileage?