Each student will be assigned a binary system. The experimental references and the conditions are indicated in the table below. The student should make use of software available on Internet to calculate the phase diagram.
The software can be downloaded from the following link:
https://www.gpengineeringsoft.com/pages/pdtmixprops.html
The student should run the program as many times as needed to be able to plot the Pxy (or Txy) diagram as calculated with the SRK and PR EoS. Comparison with experimental data should be done making use of the AAD (average absolute deviation) followed by a discussion.
The report should include (but not limited to):
1) Models used, mixing rules and parameter
2) Derived equations
3) Analysis and Discussion of results, including comparison with experimental data
4) Conclusion, comments and suggestions
Note: All assumptions should be indicated. All data, equations, etc., should be appropriately referenced.
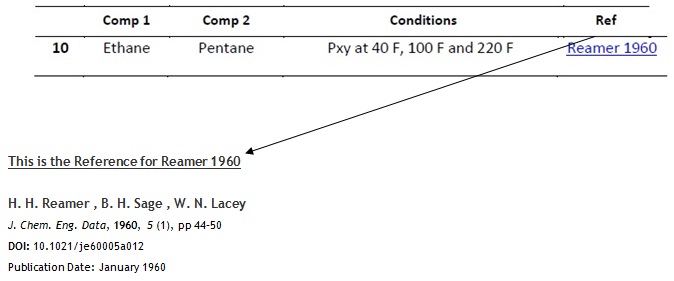
Your assigned system is: