Discuss the below:
In project, you will enter in the correct Formulas/Functions to complete a family budget that has been started for you. You will also create a pie chart that will represent the expenses for the entire year. To view these instructions while working in Excel, print these instructions or move back and forth between your browser and Excel.
1. The Orange colored cells in the "O" column and Rows 14 and 19 on the worksheet indicate places where you will put in the formulas and functions.
2. Calculate the total expenses for each month. You must use the SUM function in the cell range C14:N14.
3. Calculate the total amount for each expense item for the entire year. These must be SUM functions and will be entered into the range: O5:O13. Note: Cell O14 will actually end up holding the total amount for all expenses.
4. Calculate the Gain or Loss for each month. These must be formulas and will be entered into the range: C19:N19.
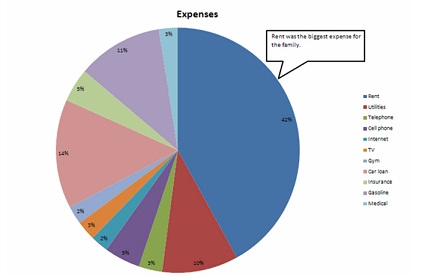
5. Create a pie chart to show the graphical representation of the expenses, using the picture below as a guide. Hint: You must select the names and their corresponding totals before selecting the pie chart from the menu. This means that ranges: A5:A13 and O5:O13 must both be selected (highlighted) before choosing the pie chart from the menu.
6. Move the pie chart onto its own worksheet and name the worksheet: Expenses.
7. Add the Callout with the text (as shown in the picture): Rent was the biggest expense for the family.
8. Add the chart title: Expenses.
9. Add Data labels to show the percentages for each item in the pie chart
| Personal budget |
|
|
|
|
|
|
|
|
|
|
|
|
|
|
|
| Expenses |
|
Jan |
Feb |
March |
April |
May |
June |
July |
Aug |
Sept |
Oct |
Nov |
Dec |
Year |
|
|
|
|
|
|
|
|
|
|
|
|
|
|
|
| Rent |
|
925 |
925 |
925 |
925 |
925 |
925 |
925 |
925 |
925 |
925 |
925 |
925 |
|
| Utilities |
|
176 |
201 |
185 |
225 |
257 |
262 |
289 |
278 |
225 |
212 |
188 |
170 |
|
| Telephone |
|
35 |
58 |
68 |
35 |
78 |
120 |
35 |
54 |
75 |
73 |
56 |
135 |
|
| Cell phone |
|
93 |
93 |
93 |
93 |
146 |
132 |
93 |
93 |
114 |
93 |
122 |
93 |
|
| Internet |
|
52 |
52 |
52 |
52 |
52 |
52 |
52 |
52 |
52 |
52 |
52 |
52 |
|
| TV |
|
57 |
57 |
57 |
57 |
57 |
57 |
57 |
57 |
57 |
57 |
57 |
57 |
|
| Gym |
|
48 |
48 |
48 |
48 |
48 |
48 |
48 |
48 |
48 |
48 |
48 |
48 |
|
| Car loan |
|
318 |
318 |
318 |
318 |
318 |
318 |
318 |
318 |
318 |
318 |
318 |
318 |
|
| Insurance |
|
98 |
98 |
98 |
98 |
98 |
98 |
98 |
98 |
98 |
98 |
98 |
98 |
|
| Gasoline |
|
270 |
250 |
350 |
200 |
220 |
280 |
250 |
235 |
245 |
250 |
215 |
325 |
|
| Medical |
|
125 |
0 |
30 |
0 |
235 |
0 |
45 |
0 |
0 |
125 |
0 |
98 |
|
|
|
|
|
|
|
|
|
|
|
|
|
|
|
|
|
|
|
|
|
|
|
|
|
|
|
|
|
|
|
|
|
|
|
|
|
|
|
|
|
|
|
|
|
|
| Your Gross Income |
|
4200 |
4200 |
0 |
0 |
0 |
5500 |
5500 |
5500 |
5500 |
5500 |
5500 |
5500 |
|
|
|
|
|
|
|
|
|
|
|
|
|
|
|
|
| Monthly Gain/Loss |
|
|
|
|
|
|
|
|
|
|
|
|
|
|
|
|
|
|
|
|
|
|
|
|
|
|
|
|
|