Problem 1. For this problem, you need to download data about the country Badgerstan from the website:
https://mywebspace.wisc.edu/mmorey/web/102Data.xls
The file includes various data related to GDP over the 20th century . The data includes measures of the aggregate economy measured in 2000 dollars . Use the data in the rest of the calculations.
a) What is the GDP of Badgerstan in each year over the period 1991 - 2000?
b) Calculate the growth rate of GDP from each year to the next (i.e. 1900 to 1901, 1901 to 1902... 1999 to 2000). During which year was the growth rate of GDP the highest?
c) What is the average annual grow th rate of consumption (hint: average of the 50 year - to - year growth rates of consumption) over the first half of the century? Second half of the century? Which one is higher?
d) Suppose that, beginning in 2000, the following changes occur:
i. consumption grows a t 5% each year
ii. investment grows at 10% each year
iii. government spending immediately increases to $1000 and then remains constant
iv. exports increase by 2% each year
v. imports increase by 2% each year Given these changes, what will be the values of GDP over the years 2001 - 2010?
Problem 2. The Econ 102 TAs decide to throw a party for their students. Emily buys $200 worth of Sicilian - style pizza from a local pizza shop . Moheb buys Brazilian mate tea that is worth $150 but he paid $175 because it is certified as “free trade.” Zach bought $350 of pasta but he saved $50 of the pasta for his own consumption next year. Xun grew $100 worth of apples in her orchard and brought them and gave them away to the students. Pedro bought $300 of soda, although he didn’t realize th at the sodas were expired because they were bottled last year. Mitch brought no food but instead taught a lesson that the students thought was so valuable that the students together would have paid $500.
How much does the TA party contribute to US GDP th is year?
Problem 3. When Hawaii was a territory of the United States, the only production outside of the home in Hawaii occurred in the sugar industry, coconut industry, and pineapple industry. In 1920, there were 300 workers: 75 sugar cane cutters, 125 coconut tree climbers, and 100 pineapple pickers. The wages for those workers in 1920 were $1000 per year per worker. There were machines used to cut down sugar cane that were leased for $2500 per year per machine. In 1920 4 machines were used. No machinery was used to collect coconuts or pick pineapples. In 1920, the sugar company made profits of $4000, the coconut company made profit s of $2500, nd the pineapple company made profit s of $5000. Assume there were no other factor costs of production.
Given this information, w hat was the GDP of Hawaii in 1920?
Note: Problem 4 is taken from the following website: https://economics.about.com/cs/interestrates/a/real_interest.htm
Problem 4. Use the following data in the table to answer the questions:
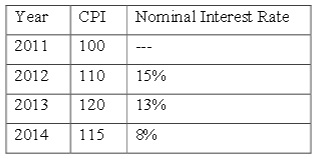
a) What is the real interest rate for year 2012, 2013 and 2014?
b) Suppose you are offered the following deal: you lend $200 to a friend at the beginning of year 2012 and charge him/her the nominal interest rate of 15% and he/she pays you back $230 at the end of year 2012. If you agree to this deal will you be made better or worse off?
Note: Problem 5 is taken from the following website:
https://www - personal.umich.edu / ~alandear/courses/102 / homework/hw01 - 07.pdf
Problem 5. Imagine an economy in which only one good – Tasty Ice Cream – is produced and consumed. Each 1/2 gallon carton of ice cream costs $5. Your last job paid you $200.
Now you want to reap the benefits of your hard labor.
You have two options: you can either indulge in ice cream right a way, and because you are an ice cream fanatic you can’t stop before you’ve used up all your money. Or you can just hold off with the purchases for one more year and receive 12% interest on your bank deposits in the meantime. Assume there is no discount factor (you are indifferent between consuming ice cream this year or one year after)
a) The nominal return on your saving in this example is 12%: you get 12% more money back than what you deposited originally. How many extra dollars will you have available to sp end after one year? Also, calculate the number of extra cartons of ice cream you will be able to buy if the price remains constant at $5 per carton. What is the percentage increase in the number of gallons of ice cream you are able to consume (real rate of return)?
Now suppose that global warming increases the cost of refrigeration, so over the course of the year Tasty Ice Cream becomes more expensive: The price per carton rises to $5.60.
b) Now what is your real return from saving your money for one year rather than consuming it right away? How many extra gallons of ice cream do you get to purchase after one year of waiting? What, in this case, is the percentage increase in the number of gallons of ice cream you will be able to consume?
The above calculations show that the real rate of return (r) on your savings (i.e. the real rate of interest) is just the nominal rate (i) adjusted for changes in price (i.e. inflation, π).
c) Use your calculations to verify the following approximation of the real rate of interest: r ≈ i – π. (Caveat: this approximation works only when both the inflation rate and the nominal interest rate are small.) Here r is the real rate of interest, i is the nominal rate of interest, and π is th e inflation rate.
d) Which interest rate – nominal or real – matters for your decision whether to consume today or tomorrow? Give a brief explanation. In your own case, would you rather consume now or wait?
Note: Problem 6 is taken from the following website:
https://mysite.avemaria.edu / gmartinez/Courses/ECON201/pdf / Nicaragua/HWansCh08b.pdf
Problem 6. Evaluate as accurately as you can how each of the following individuals would be affected by unanticipated inflation of 10 percent per year.
a) A pensioned railroad worker , assuming the pensioned railway workers have no other income and that the pension is not indexed against inflation.
b) A heavily indebted farmer.
c) A retired business executive whose current income comes entirely from interest on government bonds.
d) The owner of an independent small - town department store.
Note: Problem 7 is taken from the following website:
https://www - personal.umich.edu / ~alandear/courses/102 / homework/hw01 - 07.pdf
Problem 7. The GDP Deflator and the Consumer Price Index Price indices are very important in macroeconomics. We use them to measure inflation and adjust for its effects. This problem is designed to help us calculate and understand price indices.
There are many price indices. One is the Consumer Price Index (CPI), commonly reported in the news. The CPI calculates the cost of a certain basket of consumer goods and services each month. The change in the cost of this basket is the basis for computing the increase in the cost of living.
Another price index of inte rest in macroeconomics is the GDP Deflator, which is used to calculate real (i.e. deflated) GDP. While a fixed basket of goods and services is used in calculating the CPI, the GDP deflator is measured using the set of final goods and services that is actually produced in the economy in a given time period.
Suppose the economy of Ann Arbor produces 4 goods, but only strawberries, ice cream, and sushi are consumer goods. Coolers are also final goods, but are not bought by consumers. Assume that for the purp oses of constructing the CPI, that the level of 5 consumption in 2000 of strawberries, ice cream and sushi is set as the market basket. The total production of all goods is given in the following table followed by their prices:
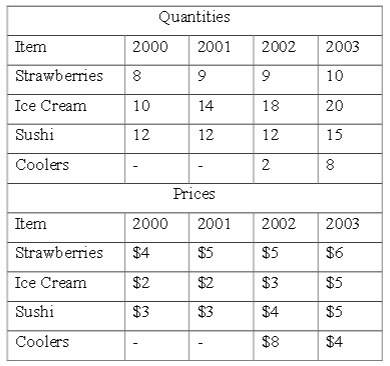
a) Using the CPI as the price index, what are the inflation rate s between 2000 and 2001, 2001 and 2002, 2002 and 2003? For the CPI assume that you are using a 100 point scale. Show your work in arriving at your final answer.
b) Calculate the rate of inflation based on the GDP deflator for all years. Use 2000 as the base year in your calculations and assume that you are using a 100 point scale. Show how you arrived at your answers.
c) Compare the inflation rat es you’ve calculated based on the CPI and the GDP deflator. How do you explain the differences? Hint: the availability of coolers improves the 6 quality of ice cream. In this example, can you detect other reasons as to why the CPI overstates inflation?
d) The following table gives the aggregate nominal income of middle class citizens in this country. In which year did they have the highest well - being? To answer this question you will need to use the CPI you calculated in (a). 2000 2001 2002 2003 $110 $115 $145 $190
Problem 8. Price Indices and New Products - People in a certain economy value two things: function and style. Products are bundles that give individuals different amounts of function and style. In years 1 and 2, there are two products which are creatively branded as product X and product Y. In year 3, a new product is created, product Z. The following table lists the prices of the goods in each of the three years, followed by how much function and style the good provides:
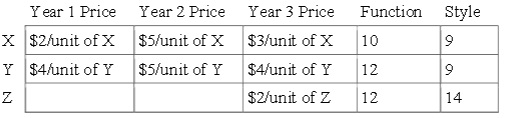
(a) If the market basket for this economy is originally 1 unit of X and 2 units of Y, what is the value, measured in dollars, of the market basket in year 1? What is the value of the same basket in year 2? If year 1 is defined to be the base year, what is the CPI in year 2 (the CPI in year 1 will be 100)? What is the inflation rate between years 1 and 2? (Hint: You wil l not need the "function" and "style" columns to find these answers.)
(b) A problem with using CPI to measure the "average" price is that it is defined in terms of goods. So, when a new product is introduced, it is difficult to decide how much of that product should be included in the "market basket" for the economy. For example, good Z above causes problems when trying to compute inflation between years 2 and 3. What if the BLS (Bureau of Labor Statistics) took the following approach: instead of tracking the change in price of the goods, they tracked the change in price of the different characteristics of the good? Say, instead, they defined the market basket as a certain amount of function and style. What function and style basket would be equivalent to the basket from part (a)?
(c) If you can only consume discrete (1,2,3...) amounts of each good, what is the least amount a consumer can spend to get at least the function and style basket in part (b) in the years 1, 2, and 3.
(d) Now, take the values computed in (c) as the value of the market basket in years 1, 2, and 3. Calculate the inflation rate between years 1 and 2, and the rate between years 2 and 3.
(e) Did the inflation rate calculated in part (a) over or under - state inflation from years 1 to 2 as measur ed in (d)? Calculate the CPI from years 2 to 3 by using the same market basket as in part (a) (2 units of Y and 1 unit of X) and the same base year (year 1). Does the inflation rate between years 2 to 3 calculated using the “goods” - based CPI over or unde rstate the inflation rate calculated in part (d)?