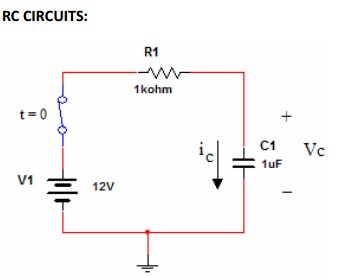
Assume that capacitor is completely discharged when t<0. Plot these graphs in MATLAB or any other computing software that you are comfortable with.
For the RC circuit in the figure:
1) Hand calculate the expression for the voltage and current of the capacitor and plot these equations by using MATLAB.
2) Plot the capacitor voltage and current for R=200Ohm and C=1µF, R=5k and C=700mF and comment about the differences you see in the graphs.
3) Calculate the time constants of each circuit and point out this time constants at your voltage graphs.
4) Hand calculate the expression for the voltage and current of the resistor and plot these equations by using MATLAB.
5) Assume the output is taken from the capacitor in this RC system with R=200Ohm and C=1µF. Plot the step and impulse response of the system by using the LSIM (you can use TF function before LSIM to calculate your system coefficients) function of MATLAB.
6) Assume the output is taken from the capacitor in this RC system with R=200Ohm and C=1µF.
This RC system is a first order low pass filter with a break frequency. Calculate the break frequency for this system.
7) Apply two ac signals (x1(t) and x2(t))to your system by using LSIM function of MATLAB. X1(t) is a sinusoidal signal with 500 Hz frequency and x2(t) is a sinusoidal signal with 100 Hz frequency. You will notice different effects of your RC system (low pass filter) to these signals.
What is the reason for this difference.