Discuss the below:
Exhibit 1 An insurance company selected samples of clients under 18 years of age and over 18 and recorded the number of accidents they had in the previous year. The results are shown below.
Under Age of 18 Over Age of 18
n1 = 500 n2 = 600
Number of accidents = 180 Number of accidents = 150
We are interested in determining if the accident proportions differ between the two age groups
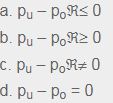
Q1)Refer to Exhibit 1 and let pu represent the proportion under and po the proportion over the age of 18. The null hypothesis is
Q2)Refer to Exhibit 1. The pooled proportion is
a. 0.305
b. 0.300
c. 0.027
d. 0.450
Q3)Refer to Exhibit 1. The test statistic is
a. 0.96
b. 1.96
c. 2.96
d. 3.96