Changes in total revenue by price falls
When the price falls along such demand curve for pizza, in that case total revenue: (w) falls. (x) rises, then falls. (y) rises. (z) does not change. Can anybody suggest me the proper explanation for given problem regarding Economics generally?
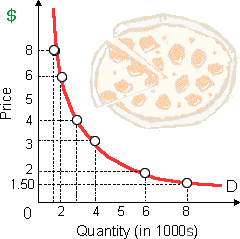
When the price falls along such demand curve for pizza, in that case total revenue: (w) falls. (x) rises, then falls. (y) rises. (z) does not change.
Can anybody suggest me the proper explanation for given problem regarding Economics generally?
Question #2 Consumer Demand. How to answer questions from a-g iii. I belive the MRS is 2y/x for B. But not sure
Describe the relationship between Total utility (TU) and Marginal utility (MU)? Answer: Q : Monopolistic competition in the long This figure demonstrates a: (w) long run equilibrium for a firm in a perfectly competitive industry. (x) short run equilibrium for a natural monopoly. (y) short run circumstances for a monopolistically-competitive firm into long run equilibrium. (z) cartel which maxim
This figure demonstrates a: (w) long run equilibrium for a firm in a perfectly competitive industry. (x) short run equilibrium for a natural monopoly. (y) short run circumstances for a monopolistically-competitive firm into long run equilibrium. (z) cartel which maxim
Consider goods for that various people are willing and capable to pay much more than the costs of production therefore widespread shortages exist. International federal or agreements, state and local laws as well as regulations are probably key factor
The arc elasticity of demand Ajax for labor in between point a and point b is about: (i) 0.25. (ii) 0.50. (iii) 0.75. (iv) one. (v) two. Q : LEAST capable inventories of A competitive firm is LEAST capable to adjust its inventories throughout the: (w) market period. (x) short-run. (y) intermediate period. (z) long-run. Hello guys I want your advice. Please recommend some views for above Eco
A competitive firm is LEAST capable to adjust its inventories throughout the: (w) market period. (x) short-run. (y) intermediate period. (z) long-run. Hello guys I want your advice. Please recommend some views for above Eco
Can someone please help me in finding out the accurate answer from the following question. The relative monetary values organizations put on selling a bit more or less of a good are termed as: (i) Supply curves. (ii) Gain-maximizing prices. (3) Supply prices. (4) Pric
Define Ex-ante aggregate demand: This is planned or the desired aggregate demand.
The economic cost borne by you as the college student which would be ignored by the bookkeeper whenever computing costs however that economists would consider the implicit cost of your education would be: (1) Food, similar costs and rent which you would incur even whe
What drives market towards their equilibrium?
18,76,764
1936409 Asked
3,689
Active Tutors
1453579
Questions Answered
Start Excelling in your courses, Ask an Expert and get answers for your homework and assignments!!