Histograms in relation to mean, standard deviation and IQR.
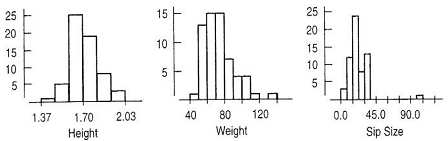
Researchers in Cornell University's Food Sciences department study how people experience foods. One study considered how much liquid people characteristically take into their mouth in one "sip" (in milliliters). The researchers also recorded the height (meters) and weight (kilograms) of the participants. Here are histograms of 3 of the variables from that study:
a) For which of the variables depicted in the histograms would you be most satisfied to summarize the center with a mean? Describe.
b) For which of the variables depicted in the histograms would you most strenuously insist on using IQR rather than a standard deviation to summarize spread? Give details.