Question 1
Explain with numeric example that marginal revenue is always lower than price when monopolists charge single price for each and every one units to sell.
Question 2
Starbucks Closed 61 Coffee Shops in Australia
Starbucks slashed its Australian presence subsequent to years of multimillion-dollar losses and a failure to make inroads. The world’s biggest coffee chain axed 685 jobs and close 61 of 84 stores nationwide.
People interviewed said:
1) There are a lot of better coffee shops;
2) Starbucks had issues with site selection and an imperfect food menu;
3) Australians like to sit down and relax with a cup of coffee rather than taking it away in a paper cup; and
4) Starbucks was rebellious with overpriced coffees that failed to meet Australian standard.
Answer the following questions:
a) In what market does Starbucks struggle?
b) Illustrate the revenue, costs, and profit that Starbucks anticipated when it entered this market. Draw a graph to illustrate your answer.
c) How did the factors listed as (1) to (4) above affect Starbucks’ revenue, costs, and profit? Draw a graph to demonstrate your answer.
Question 3
How firm supply curve is derived in short run? Clarify with graphs.
Question 4

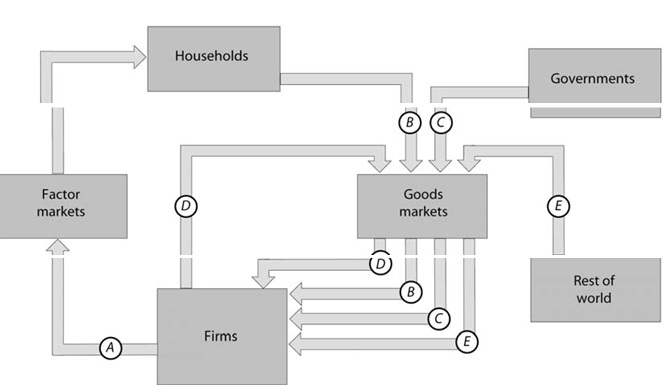
The figure above shows the flows of expenditure and income in the Australia. Throughout 2006-07, B was $585 billion, C was $231 billion, D was $241 billion, and E was –$13 billion.
Name the flows and compute the Aggregate expenditure and Aggregate Income and GDP. Elucidate among their relationships.
Part B
Question 1
The following events have happened globally in recent years:
• A deep recession hits world economy.
• The world oil price increases sharply.
Do you think the economy can be liberated if the Keynesian policy is followed? Elucidate your arguments.
Question 2
Poor India Makes Millionaires at Fastest Pace
India, with the world’s largest population of poor people living on less than a dollar a day, also paradoxically created millionaires at fastest pace in world in 2007. … Growing them at a blistering pace of 22.7 per cent, India added another 23,000 more millionaires in 2007 to its 2006 compute of 100,000 millionaires measured in dollars. … In distinction, developmental agencies put the number of subsistence level Indians living on less than a dollar a day at 350 million and those living on less than $2 a day at 700 million. In other words, for every millionaire, India has about 7,000 impoverished people. ...
(The Times of India, June 25, 2008)
Subsequent the limitations of real GDP estimation and particularly estimation problems associated with across countries inspect the validity of this statement.